Filtering sheets to print using Revit RTV Xporter Tools

Filtering sheets to print using Revit RTV Xporter Tools

Hello there, I trust you all are well.

Someone within the company asked if he can print PDF’s using dynamo with the current revisions of the drawings? I said yes but instead of using Dynamo, why don’t you use RTV Xporter tools? Most of us have this tool installed anyway on our machine. However, some do not know how to use it.

If your company doesn’t have the license for this tool, why don’t you give it a try by availing the 30 days free trial? Here is the link where you can download the “RTV Xporter” Revit plugin.

https://www.rtvtools.com/product/rtv-xporter/

I know some of you who have been using Revit for a number of years find this not interesting but for those who are just starting to learn Revit, carry on reading this post.

Today I will talk about how to add the parameter which you can use as a filter in selecting the drawings you want to print using RTV Xporter Tools add-in in Revit.

This is just one way of extracting PDF/DWG/DWF/ etc. in your Revit model and, honestly,  it works for me well.

Blog_10_00

I will add an additional text parameter for the sheets. As you can see here, I only have Graphics and Identity Data as my sheet parameters.

Let me first create a Shared Parameter.

Blog_10_01Blog_10_02

Save it to the project folder or you can open your company Shared Parameter and add this to that, if it allows you to do so, if not, just create one and save it to your project folder.

Blog_10_03

For this demonstration, I save it on My Documents folder as shown below then create a new Group.

Blog_10_04

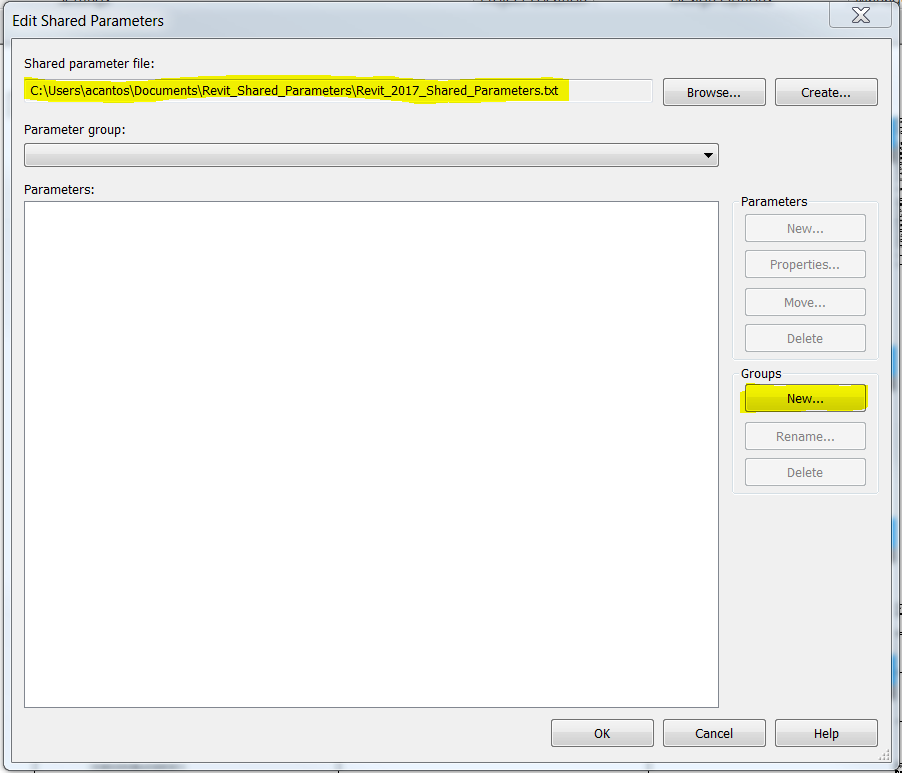
Add the Parameter Group Name

Blog_10_05

Here you’ll create your new parameter. I called it “Print_Date” under “Text” type parameter.

Blog_10_06

Click OK then OK.

Blog_10_07

Next, I will add this new text parameter as one of our Project Parameters. Click on Project Parameters under the Manage tab.

Blog_10_08

Click Add…

Blog_10_09

Choose the Shared Parameter and only choose “Sheets” under categories

Blog_10_10

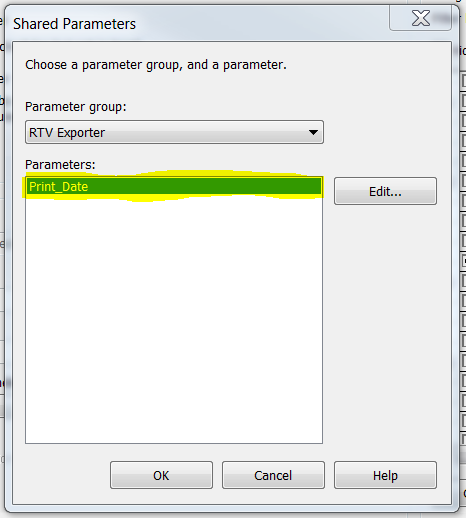
Select the newly created text parameter then click OK.

Blog_10_11

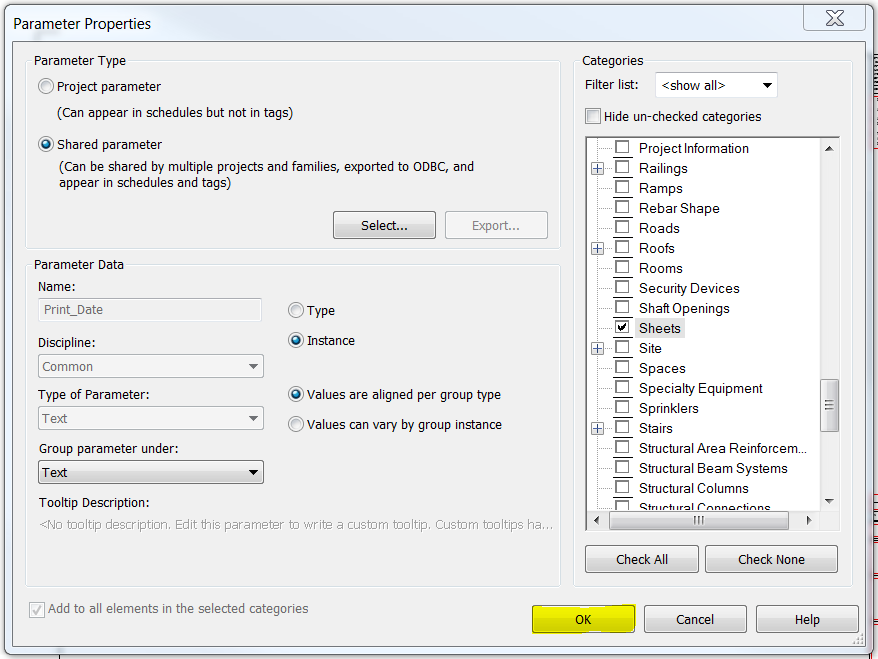
Click OK to exit the Parameter Properties window.

Blog_10_12

As you can see, the new text parameter is now added as one of your Sheet Parameters.

Blog_10_13

Now, I’ll highlight all the sheets I wish to print and put any value on the Print_Date parameter. For this exercise, I will use today’s date.

Blog_10_14

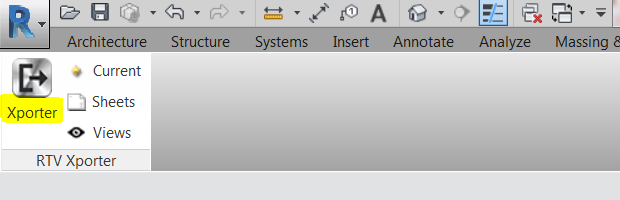
Next, go to the RTV Tools tab and click on the Xporter icon.

Blog_10_15

A getting started with RTV Xporter will pop up and I encourage you all to visit each section to help you familiarize with its interface and functions. If you do not want to see this window the next time you open RTV Xporter, just untick “Show at startup”.

Next, click “Close” and it will bring me to the RTV Xporter interface.

Blog_10_16

Go to Project Parameters tab and click on Parameters

Blog_10_17

Make sure the newly added parameter is checked.

Blog_10_18

Then I have to close the RTV Xporter window in order for the new parameter to take effect. Click “Exit” which can be found in the lower right-hand corner.

Blog_10_19

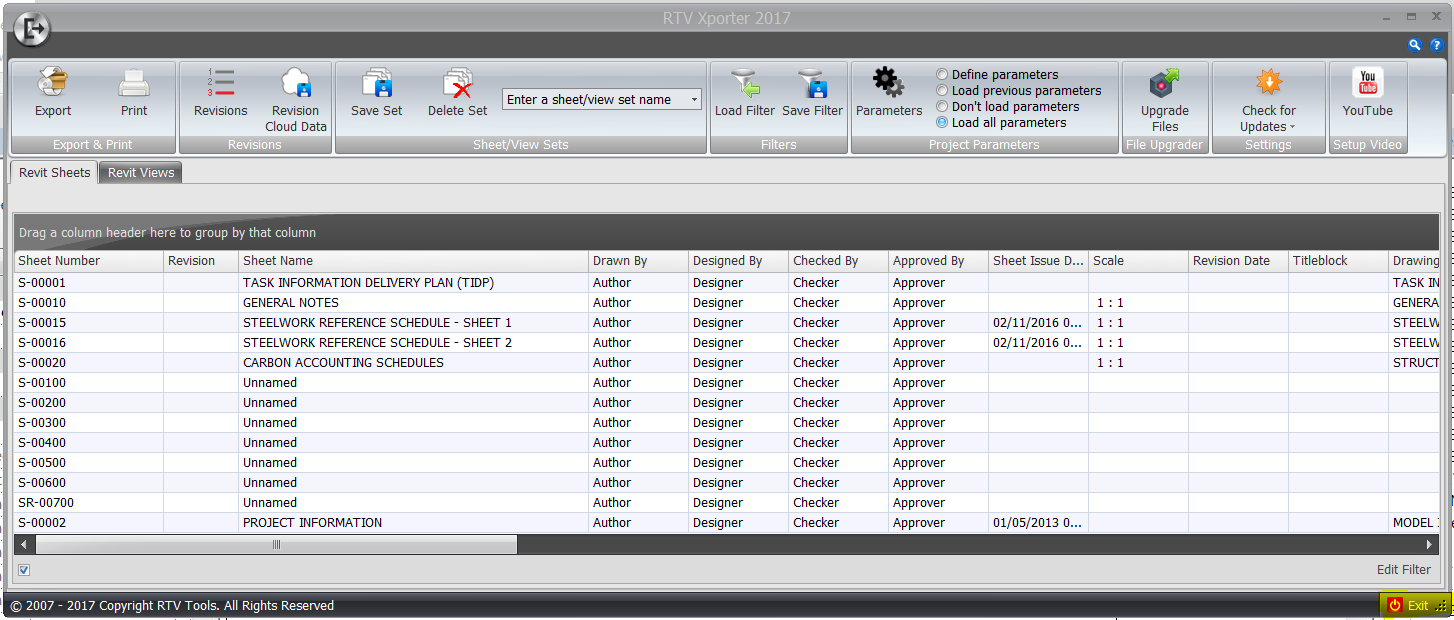
Open again the RTV Xporter tools.

Blog_10_20

As you can see, Print_Date is now added in one of the columns. You just need to scroll right to find this column.

Blog_10_21

And here, I have the ability to filter all the drawings as shown.

Blog_10_22

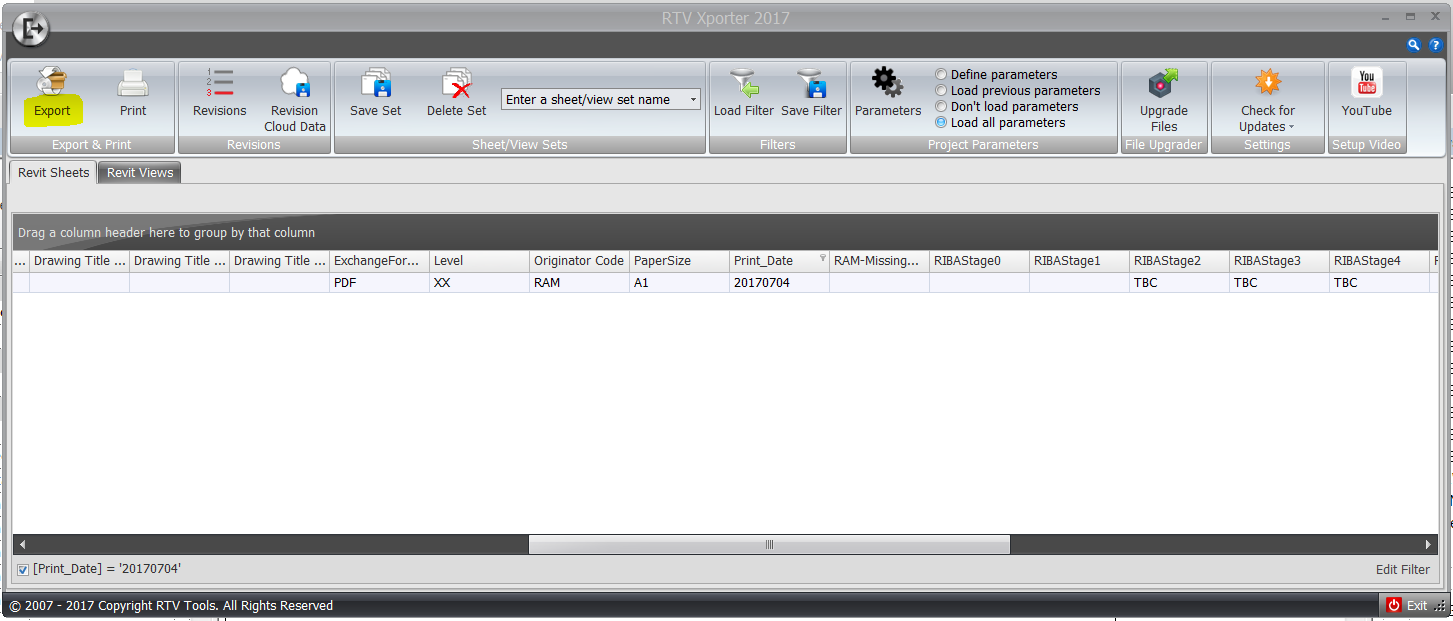
All the drawings with 20170704 Print_Date parameter value will be filtered as shown.

Blog_10_23

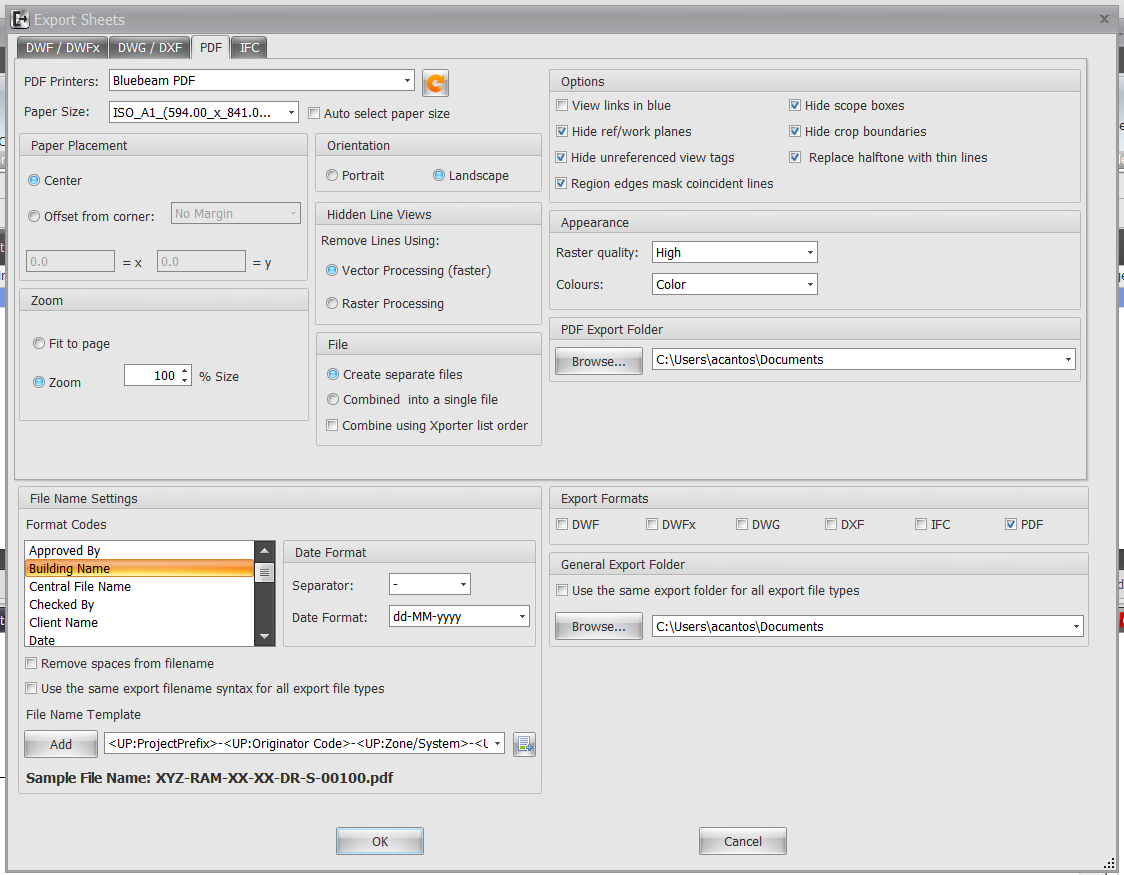
And here is where I configure your printing settings and output. This section should be covered in the video tutorial that you can be accessed in the RTV Xporter Startup window or YouTube icon located in the upper right-hand corner.

Let me use Bluebeam PDF as my PDF Printer.

Blog_10_24

It will be annoying if you have 100 sheets to print and you need to click the Save button for each individual file.

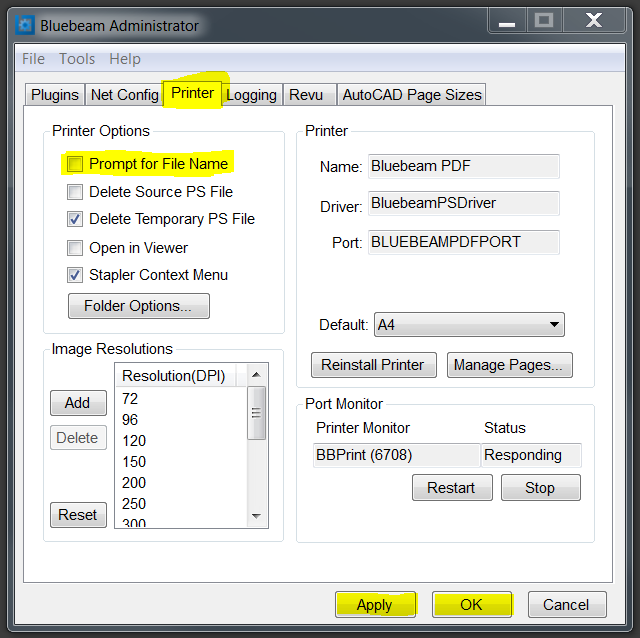
To fix it, jump to your Bluebeam and follow the procedure below.

Blog_10_25

Blog_10_26

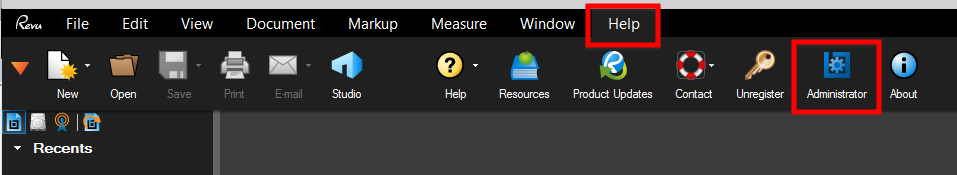
Then un-check the option saying “Prompt for File Name”

Blog_10_27

That should be it. The next time you print using RTV Xporter Tools, you don’t need to hit save for each individual drawings.

Again, this is just one of the options in exporting PDF/DWG/DWF etc. if you have RTV Xporter. If you don’t have one, printing can be accessed in the Revit menu options.


Sharing will enrich
everyone with more knowledge.

Ana Monnar

(*1954, Cuban-born, founder of Readers Are Leaders U.S.A.)


I welcome your comments, questions, corrections and additional information relating to this article. If you know a better way, please leave your comment, by all means, let me know.

If you want to create your own WordPress blog/website, signup by using the link below.

https://refer.wordpress.com/r/1852/wordpress-com/

Have a great day!

Cheers,

Allan Cantos

Uploading your Dynamo Graph to Autodesk Dynamo Studio

Hi, today we’ll talk about uploading your Dynamo Graph to Autodesk Dynamo Studio. This is a continuation of my previous post about Dynamo Hackathon Challenge 01.

I will run you through the process of uploading your Dynamo graph and this process is actually straightforward.

First, go to the link below. You can use the software for a 30-days trial period if your company doesn’t have a license yet to activate it. You will need to have permission obviously to have the software installed on your machine if you do not have full admin rights.

https://www.autodesk.com/products/dynamo-studio/overview

Once you have the software installed, run it as you normally do when opening a program.

The interface is the same when you launch Dynamo from within Revit. Using Autodesk Dynamo Studio, you have the ability to post your Dynamo graph in the cloud then a corresponding URL link will be provided which you can send to everyone who would like to see and navigate on your Dynamo graph finished product.

Here is how the Dynamo graph from the previous post:

If you also recall, I used dimensions in millimetres on my Inputs:

But I was having a problem visualizing it once I uploaded the graph on Dynamo Studio and to fix that I converted those Input dimensions to metres.

These are the only changes I made on this graph, the rest are all the same.

Now we are ready to upload it on the cloud.

Provide the necessary information:

And hit “Publish”

Then you’ll see a URL link for your Dynamo graph that you can distribute to all your contacts who are part of the design team.

If you want to see how your graph looks like on the web, click on “Visit”

The link requires WebGL, so use Chrome, not IE.

Here is the error I’ve got when I tried to open the link using Internet Explorer:

Once again, here is the link for those who would like to play around the Inputs.

https://dynamo.autodesk.com/share/594fd76187a6904902481c0b

Can I get thumbs up? How about clicking to Share this blog with your network. Leave a comment too. If you know a better way, by all means, let me know. Thank you for dropping by.

If you want to create your own WordPress blog/website, signup by using the link below.

https://refer.wordpress.com/r/1852/wordpress-com/

Have a good day!

Cheers.

Allan Cantos

Dynamo Hackathon Challenge 01

Hello there. I trust all is well with you.

Today I’ll discuss Dynamo Challenge for Dynamo users within our company and we call this challenge as “dynamo hackathon”

First Challenge Description:

Part of the new state of the art research laboratory is planting equipment that services the building and is housed in the different building adjacent to the structure. Each of these buildings has a distinctive flue extract tower that rises above the building.

We need to design a supporting structure for each tower however the dimensions of the tower are likely to change. Therefore the challenge is to create a Dynamo graph that is dynamic, allowing adjustments to the width, depth, and height to be changed by the user.

It is envisaged that the tower structure will be formed from steel, beams, columns and bracing (see image below) to produce a graph that the user can assign the sizes of the elements.


Now let start the fun!

Based on the description given, we need to provide a node that the user can specify for the height, width, and length of the structures.

First, look for the “Number Slider” node searching on the Library of by right-clicking on the working area.

And place 3 of this and name it accordingly. I’ll leave it to you to provide the minimum, maximum and step values.

Next is to start creating the first column. We know that column consists of two nodes, the top node, and the bottom node. To be able to have those nodes, we need to place a point. Let me assume that my first point or node is at (0,0,0) coordinates.

To place a point, search for “Point.ByCoordinates” node.

Without specifying the x, y and z values, the default values are x=0, y=0 and z=0.

Now we have created our first point/node.

Next is to add the other endpoint/node of the column which is offset by Z value relative to the first point and to do that, we need to have another “Point.ByCoordinates” node and connect the “Height of Structure” to “z” as shown.

Next is to connect those two nodes by a line to represent our first column C1. We need “Line.ByStartPointEndPoint” node.

Now we have created our first column.

Next step would be to offset this column in the x-direction, y-direction, and xy-direction which will represent the other 3 columns.

You’ll need this node:

The nodes that we need to connect to the geometry input are the two points so we need to create a list of the point first. This will give us the other 2 points/nodes for column C2.

Again apply Geometry.Translate to the original 2 points and this time connects the Length node. This will give us the other 2 points/nodes for column C3.

And finally, for column C4:

Next, looking at column number 2, we need to connect those 2 points to create a column and in order to do that, I need to separate them first as Point 0 as my startPoint and Point 1 as my endPoint

Do the same thing for Column C3.

And finally, Column C4

Next, we want to create beams to connect those 4 columns and at the same time specify the number of floors that this column can support. To do that, first I created a new number slider and name it NUMBER OF FLOORS as shown below.

Next is to divide the column into the number of floors by adding a parameter and a node called “Curve.PointAtParameter” Assuming number of floors to be 6.

Make it 10:

Now do the same thing for the other columns and you should have something like this,

Next, we are ready to add beams to each floor levels.

After that, we are ready to add the cross bracings.

Then we will do the opposite side by starting the bracing from Column C02.

Now you can make a copy of this cross bracing to Y-Direction, which is our Length if you remember when we created the number slider.

Now it is completed, you can test it now by changing the length, width, height, and number of floors.

As you can see, it is now dynamic and you have the full control over the sizes.

The final part would be assigning the Revit member elements.

And here is the completed Dynamo graph:

I am aware that there are many ways to model this challenge in Dynamo. I do have another version but it is not completed yet. I would be happy to see your own version by commenting and posting your own version if you don’t mind.

Thank you for visiting my blog and I hope this little tutorial helps you in developing your Dynamo skills especially those beginners like me.

Unless you try
to do something beyond
what you have already mastered,
you will never grow.

Ralph Waldo Emerson

(1803 – 1882, American essayist, lecturer, and poet)


Have a great day!

Cheers,

Allan Cantos

Positive SSL