Hello there. I trust all is well with you.
Today I’ll discuss Dynamo Challenge for Dynamo users within our company and we call this challenge as “dynamo hackathon”

First Challenge Description:
Part of the new state of the art research laboratory is planting equipment that services the building and is housed in the different building adjacent to the structure. Each of these buildings has a distinctive flue extract tower that rises above the building.
We need to design a supporting structure for each tower however the dimensions of the tower are likely to change. Therefore the challenge is to create a Dynamo graph that is dynamic, allowing adjustments to the width, depth, and height to be changed by the user.
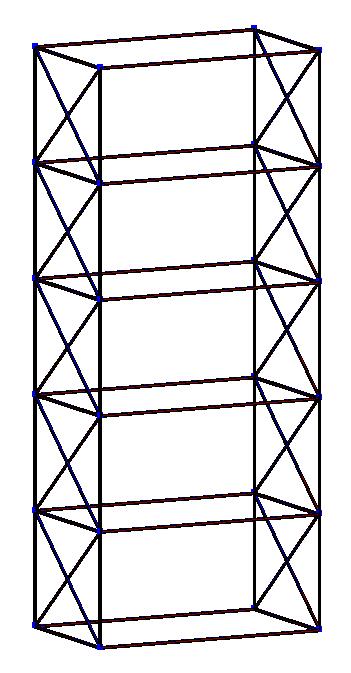
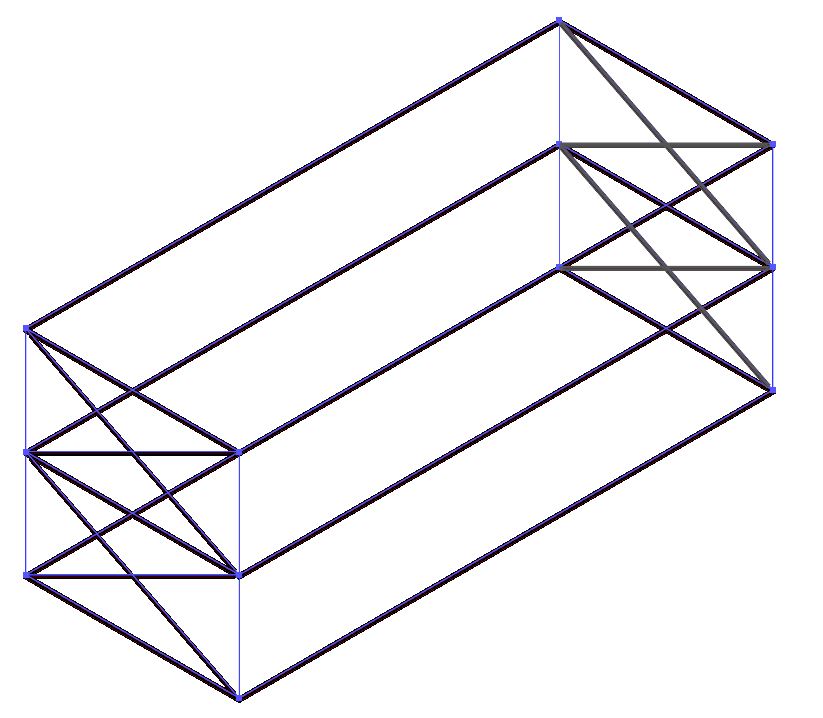
It is envisaged that the tower structure will be formed from steel, beams, columns and bracing (see image below) to produce a graph that the user can assign the sizes of the elements.
Now let start the fun!
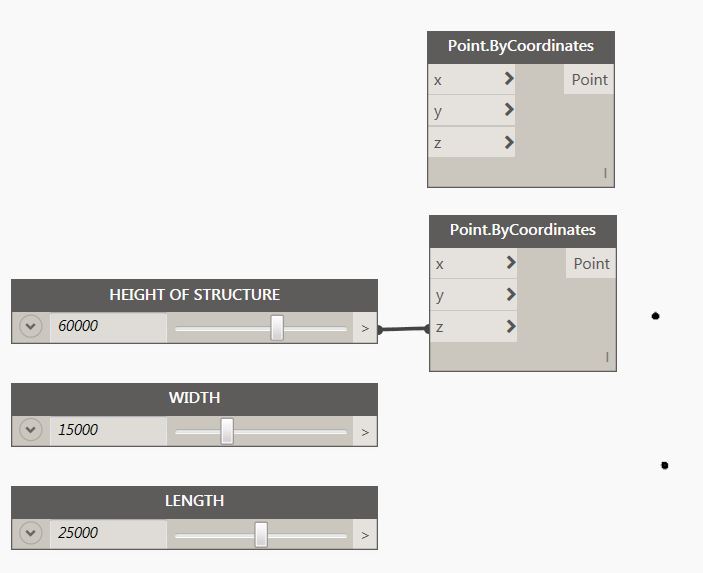
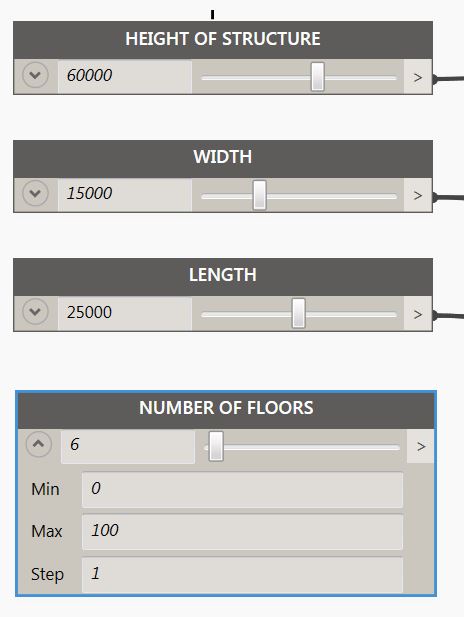
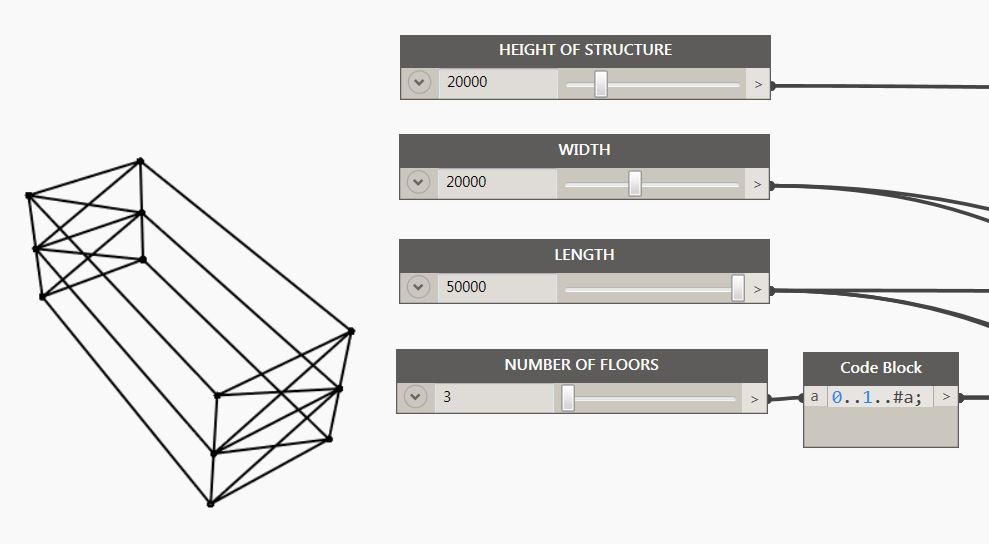
Based on the description given, we need to provide a node that the user can specify for the height, width, and length of the structures.
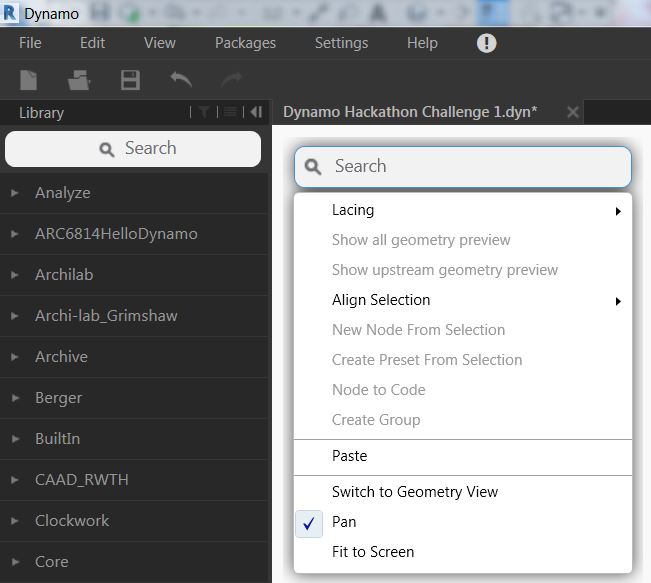
First, look for the “Number Slider” node searching on the Library of by right-clicking on the working area.
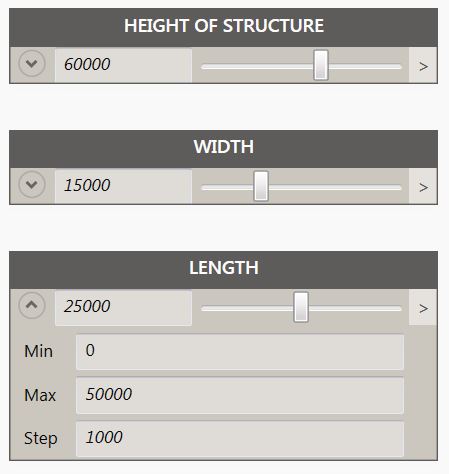
And place 3 of this and name it accordingly. I’ll leave it to you to provide the minimum, maximum and step values.
Next is to start creating the first column. We know that column consists of two nodes, the top node, and the bottom node. To be able to have those nodes, we need to place a point. Let me assume that my first point or node is at (0,0,0) coordinates.
To place a point, search for “Point.ByCoordinates” node.
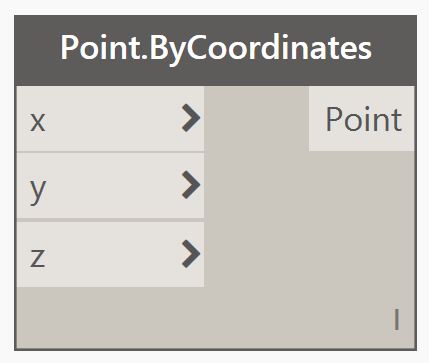
Without specifying the x, y and z values, the default values are x=0, y=0 and z=0.
Now we have created our first point/node.
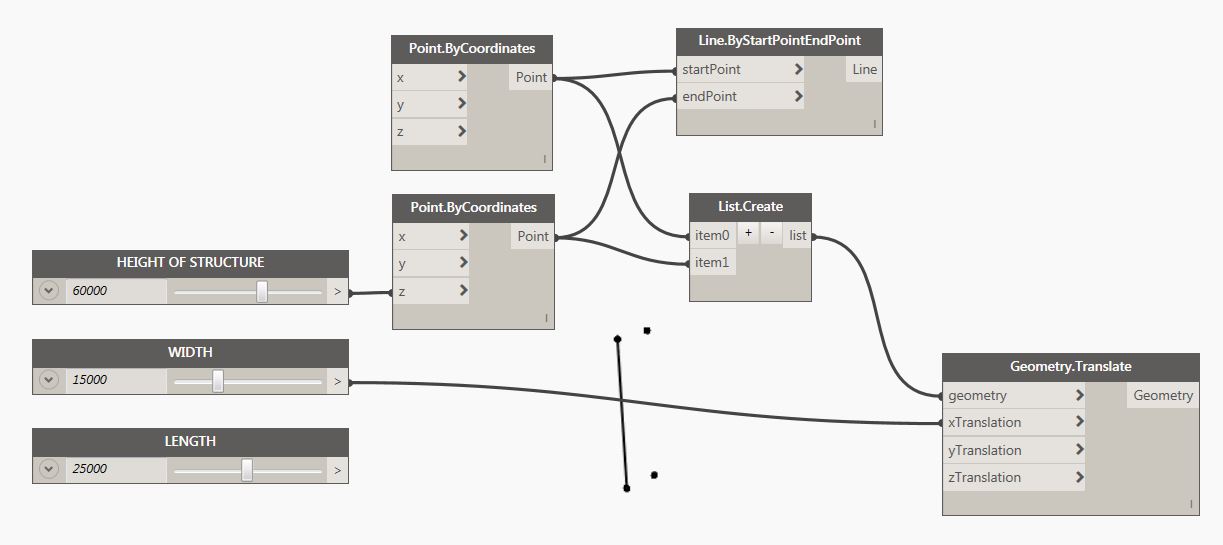
Next is to add the other endpoint/node of the column which is offset by Z value relative to the first point and to do that, we need to have another “Point.ByCoordinates” node and connect the “Height of Structure” to “z” as shown.
Next is to connect those two nodes by a line to represent our first column C1. We need “Line.ByStartPointEndPoint” node.
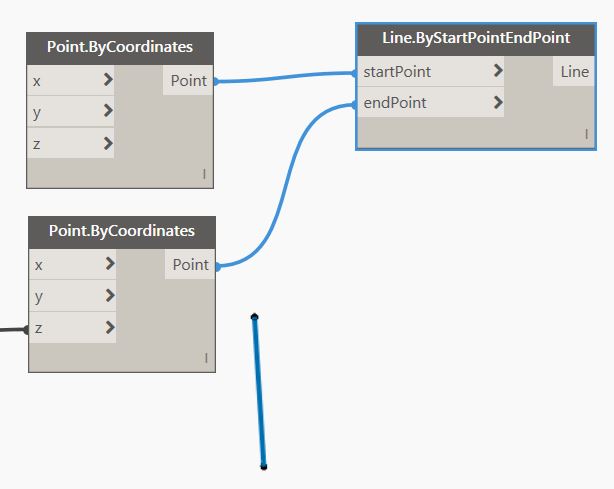
Now we have created our first column.
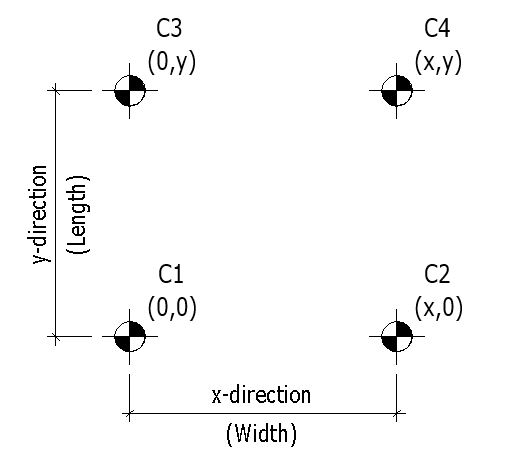
Next step would be to offset this column in the x-direction, y-direction, and xy-direction which will represent the other 3 columns.
You’ll need this node:
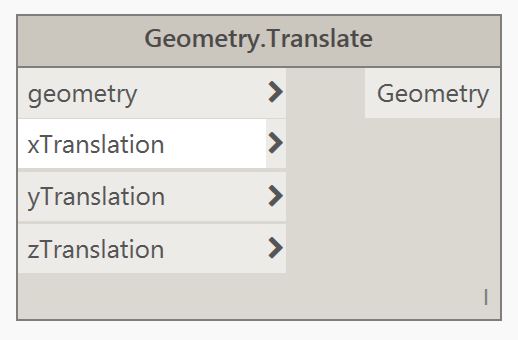
The nodes that we need to connect to the geometry input are the two points so we need to create a list of the point first. This will give us the other 2 points/nodes for column C2.
Again apply Geometry.Translate to the original 2 points and this time connects the Length node. This will give us the other 2 points/nodes for column C3.
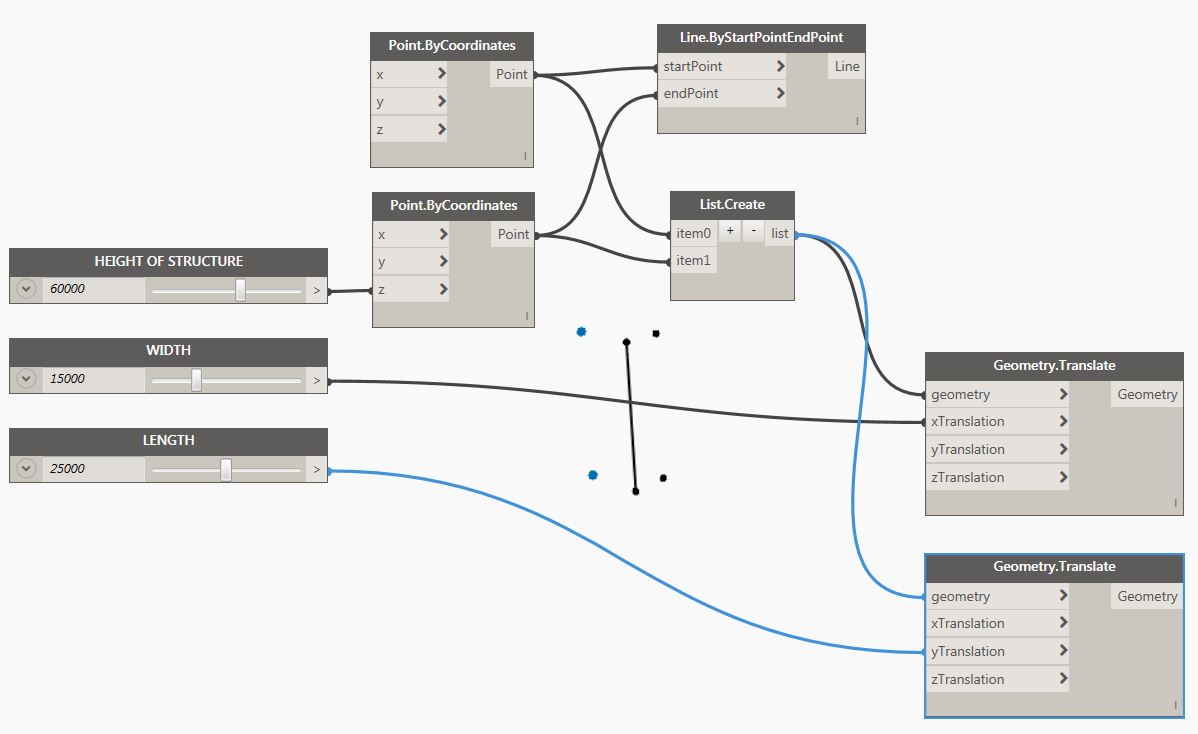
And finally, for column C4:

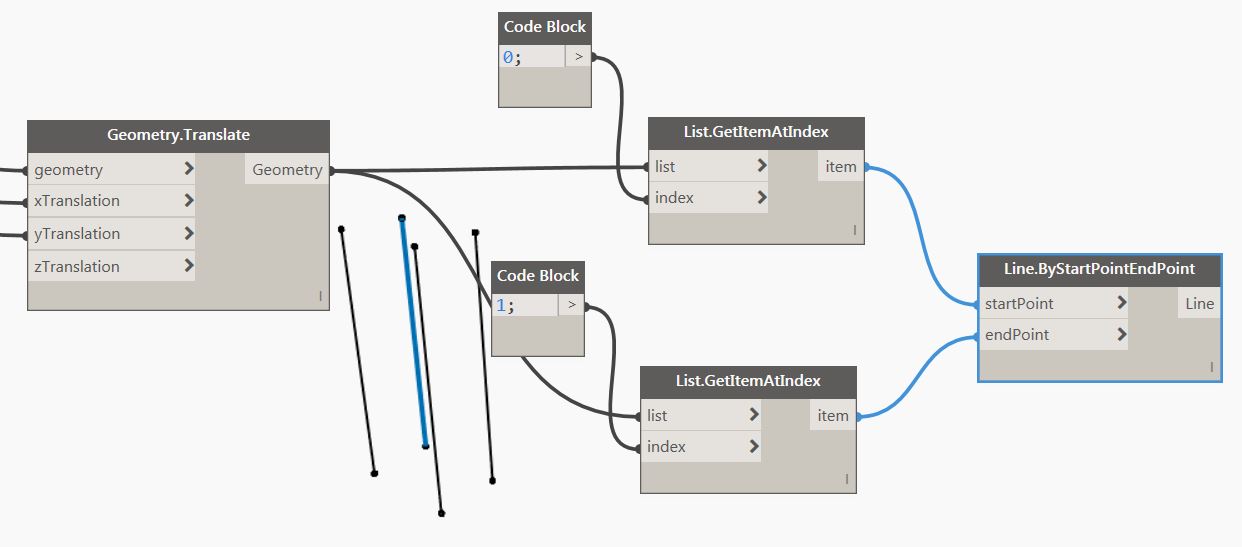
Next, looking at column number 2, we need to connect those 2 points to create a column and in order to do that, I need to separate them first as Point 0 as my startPoint and Point 1 as my endPoint
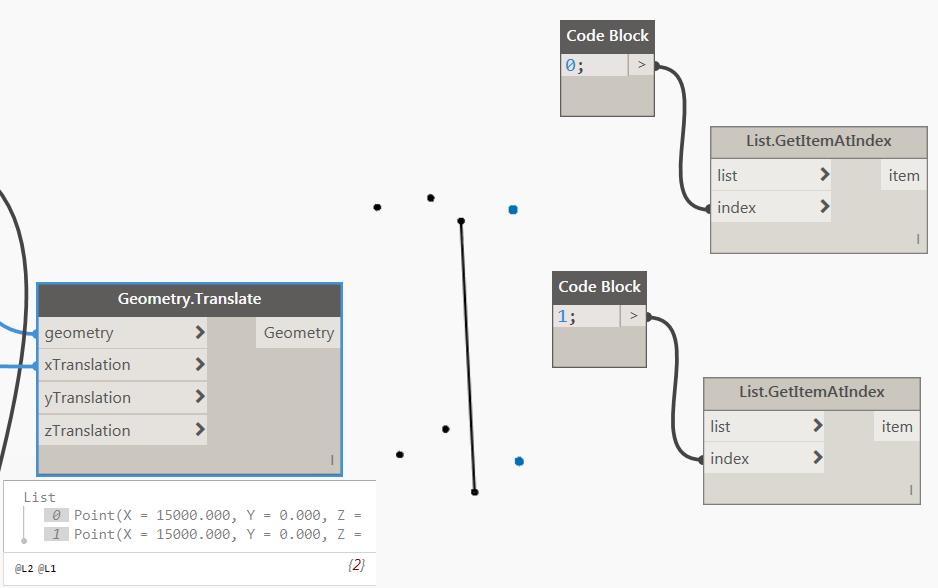
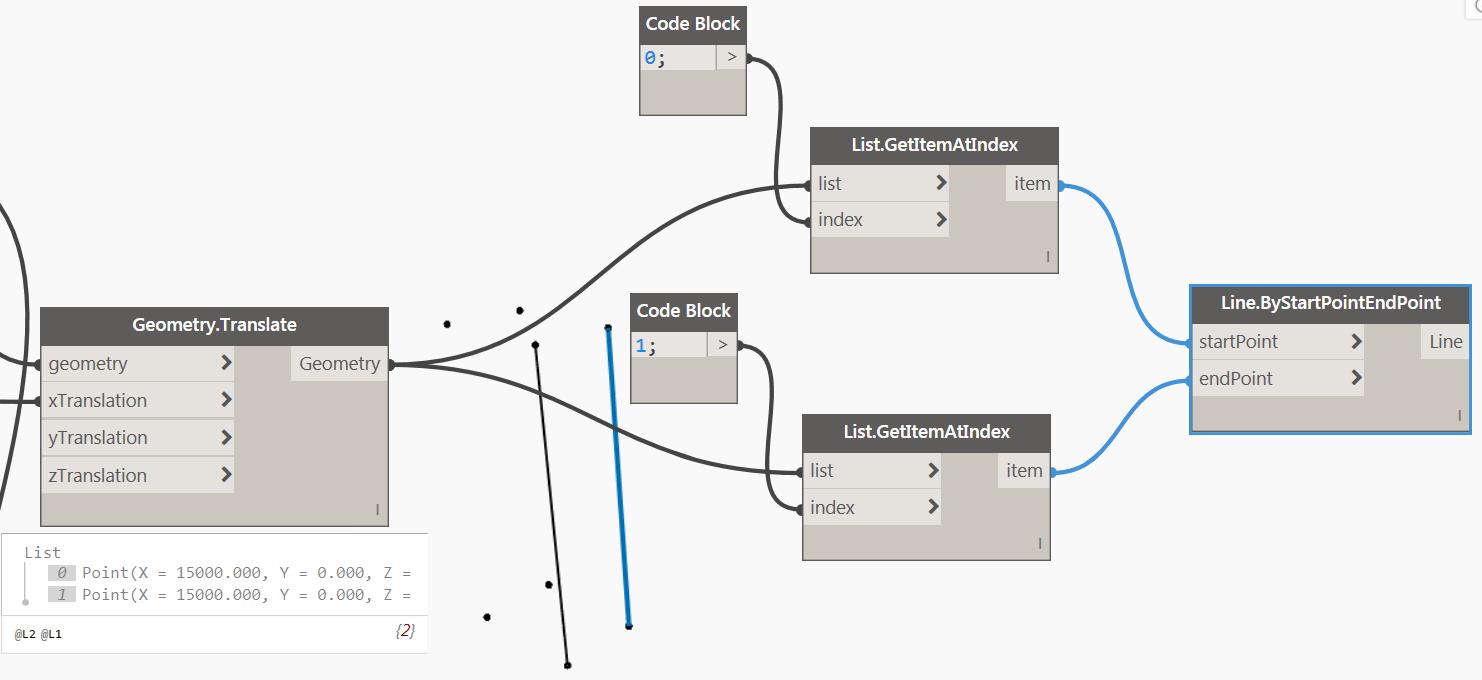
Do the same thing for Column C3.
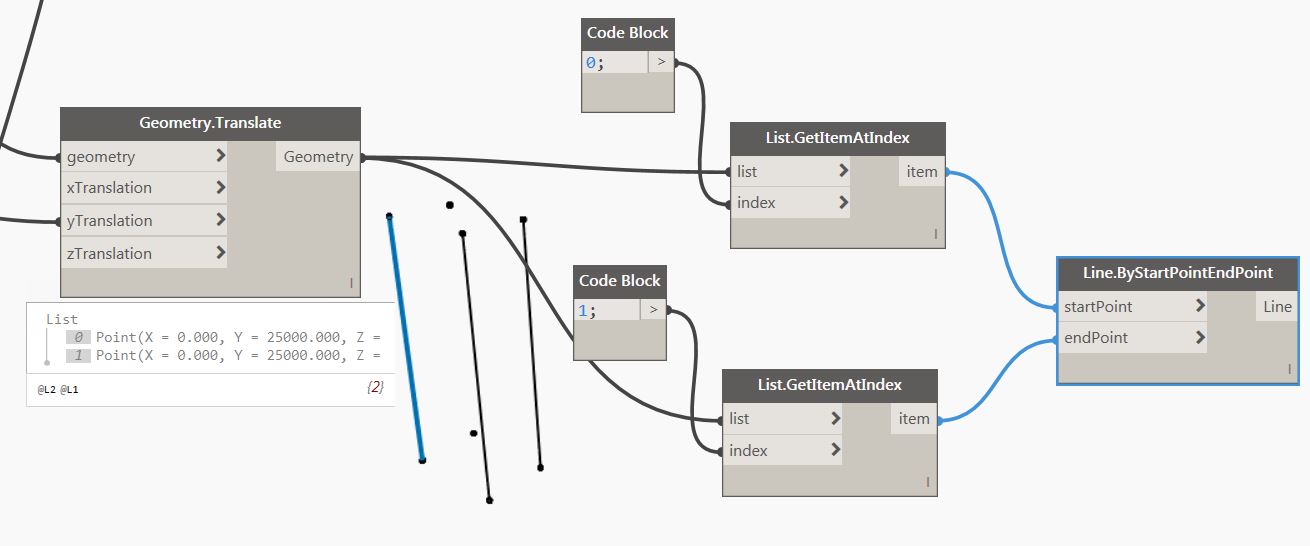
And finally, Column C4
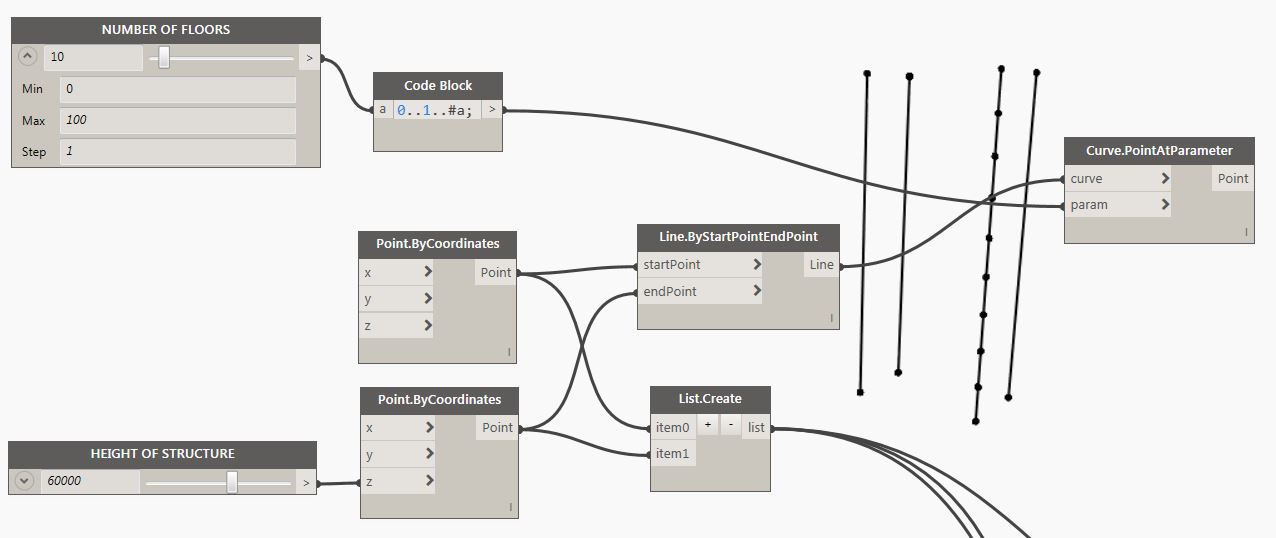
Next, we want to create beams to connect those 4 columns and at the same time specify the number of floors that this column can support. To do that, first I created a new number slider and name it NUMBER OF FLOORS as shown below.
Next is to divide the column into the number of floors by adding a parameter and a node called “Curve.PointAtParameter” Assuming number of floors to be 6.
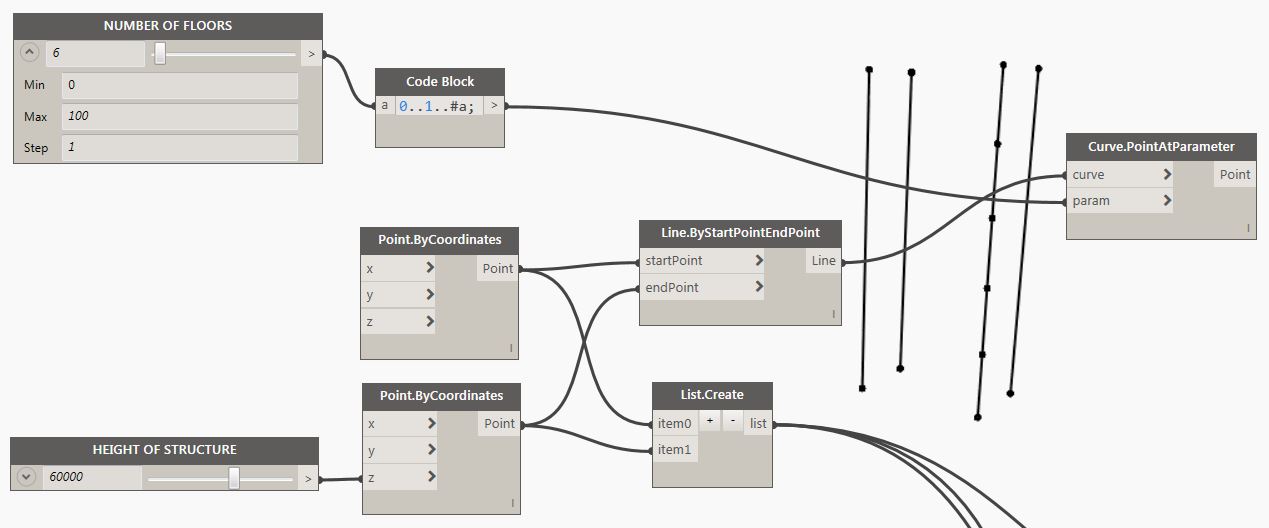
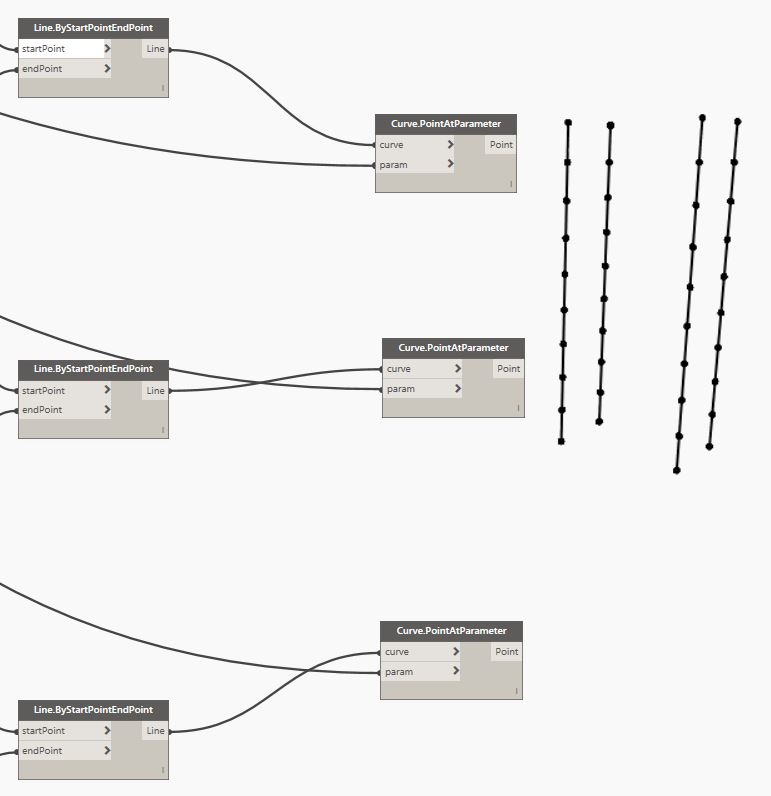
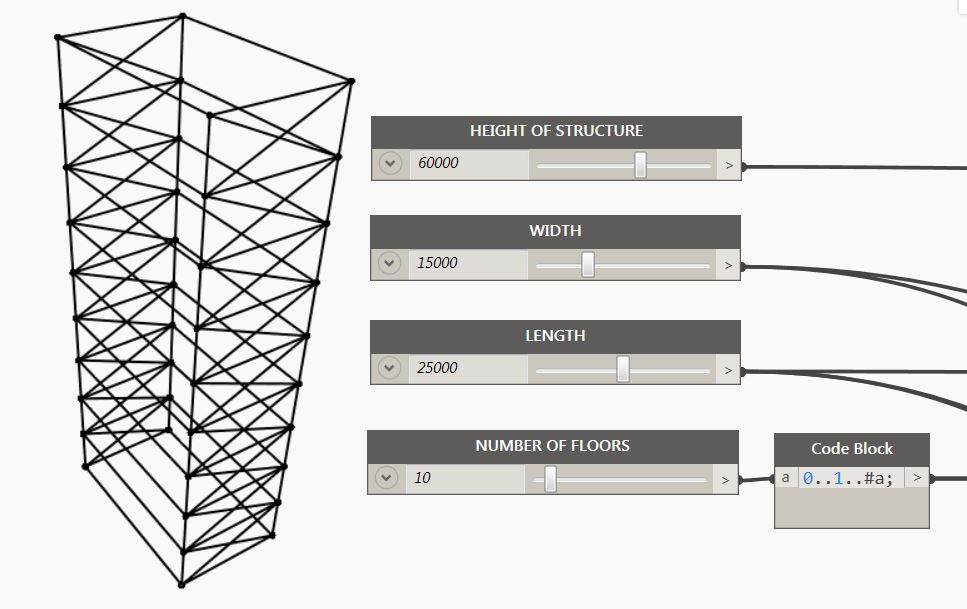
Make it 10:
Now do the same thing for the other columns and you should have something like this,
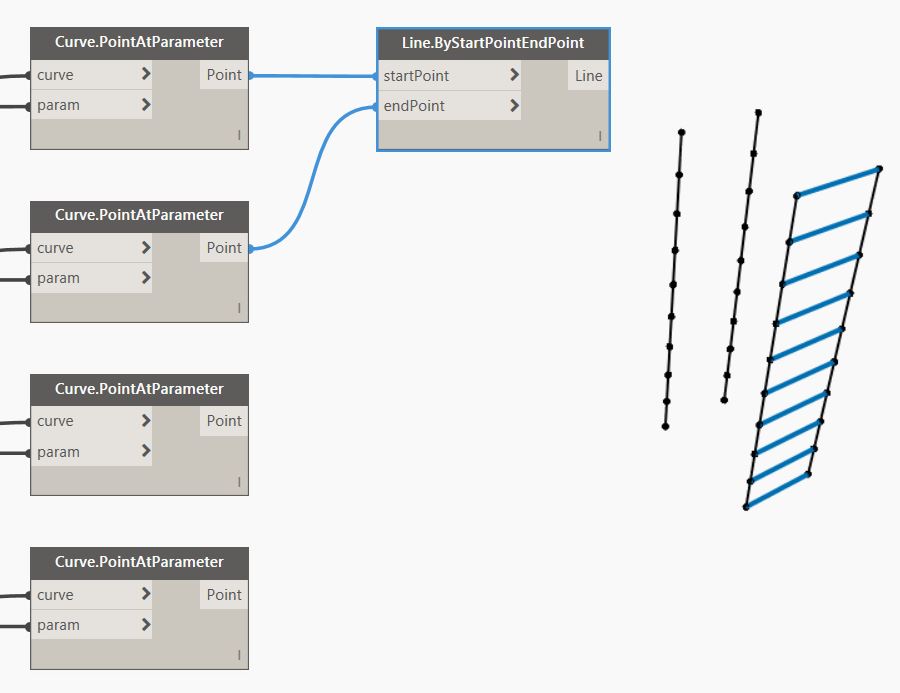
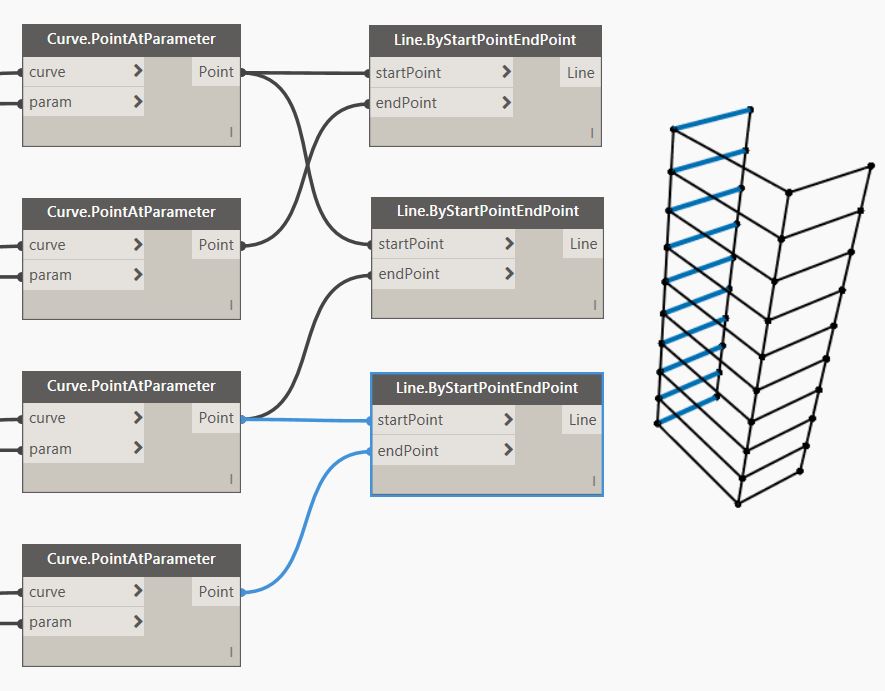
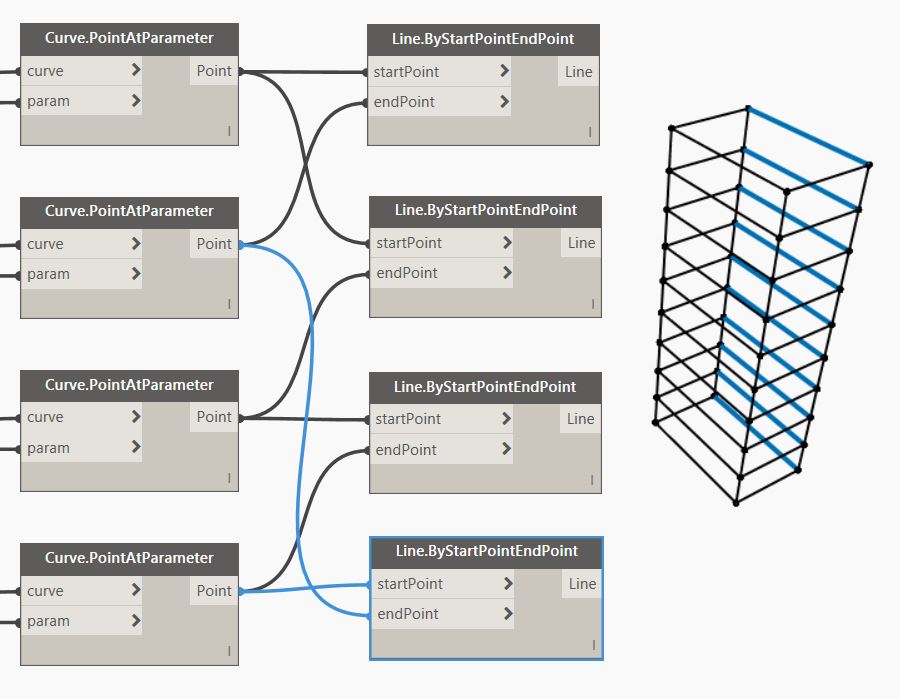
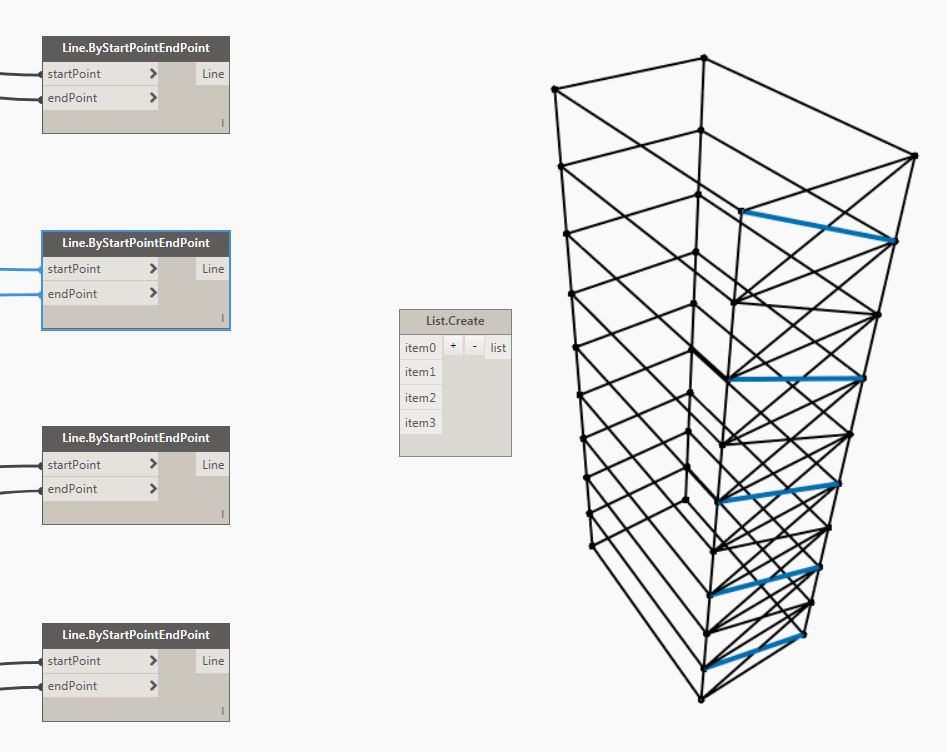
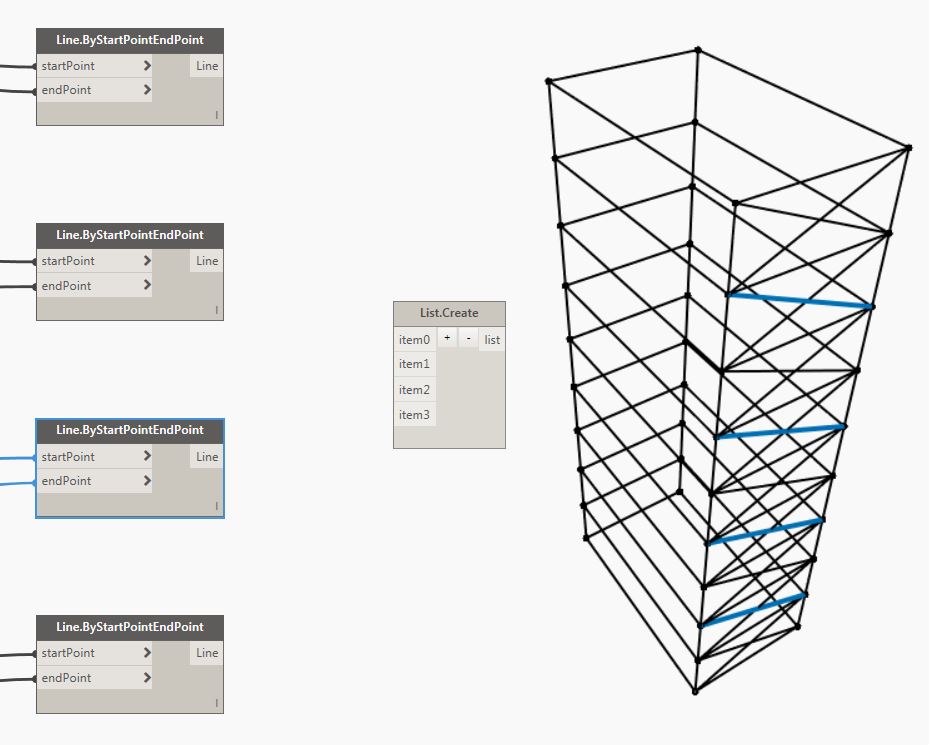
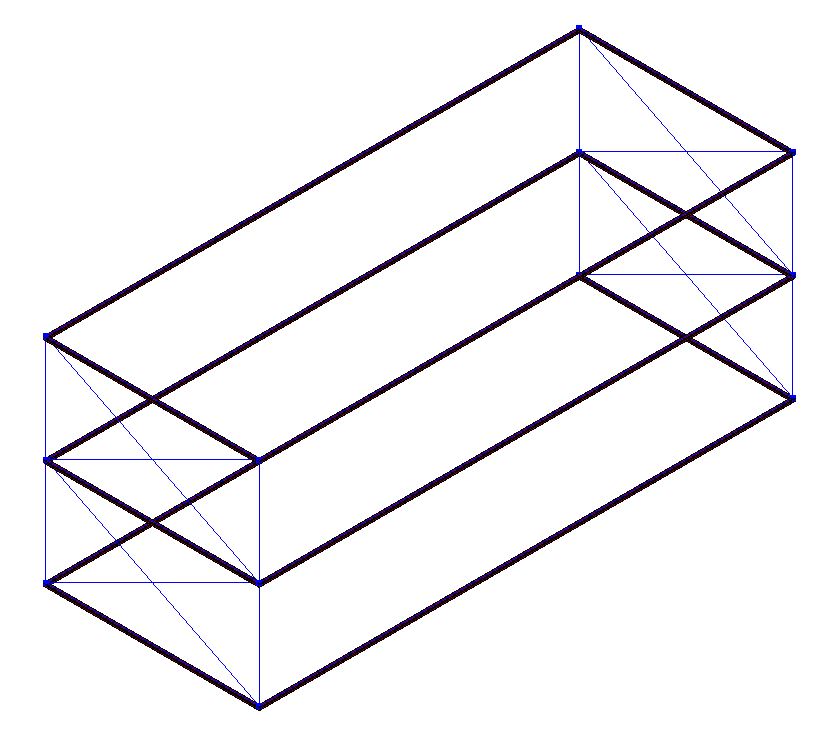
Next, we are ready to add beams to each floor levels.
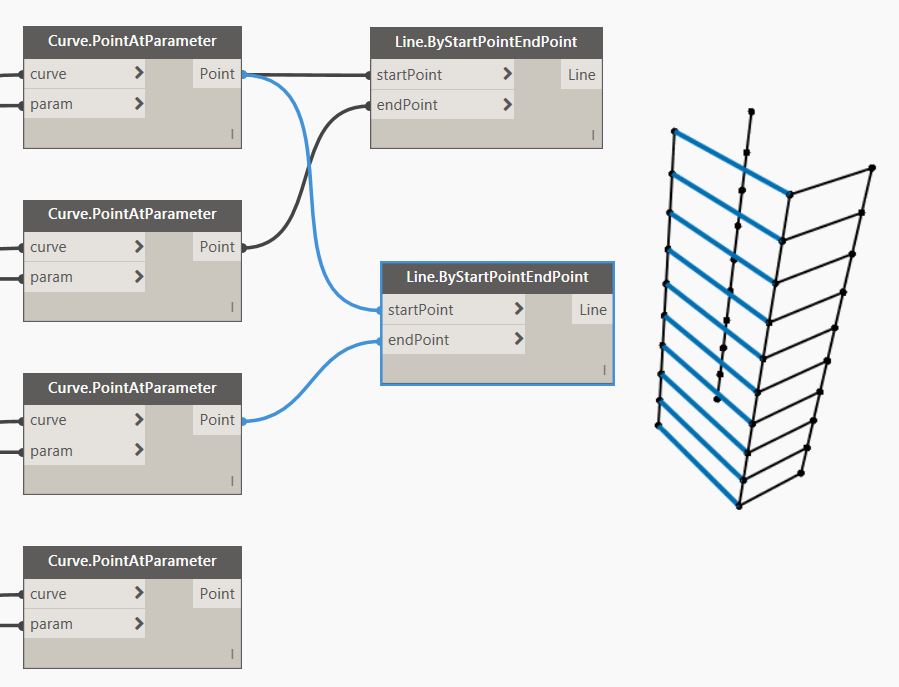
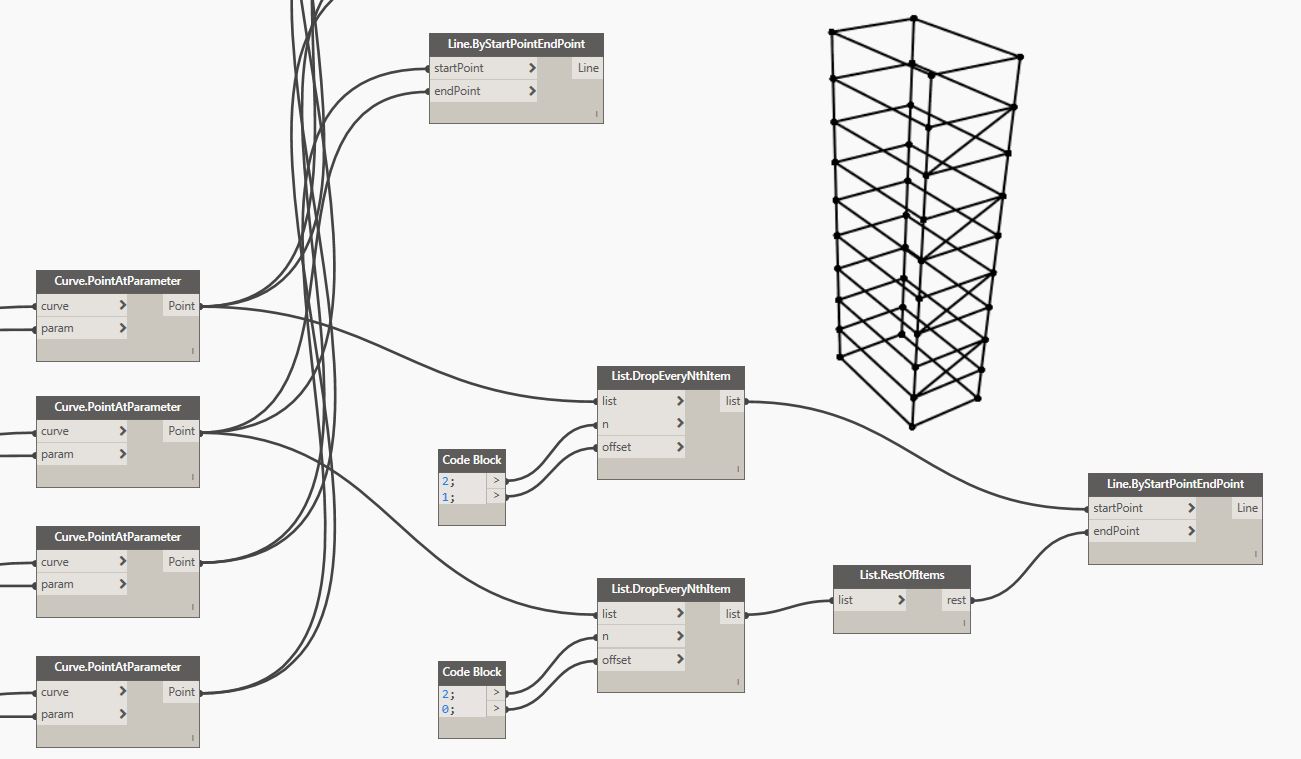
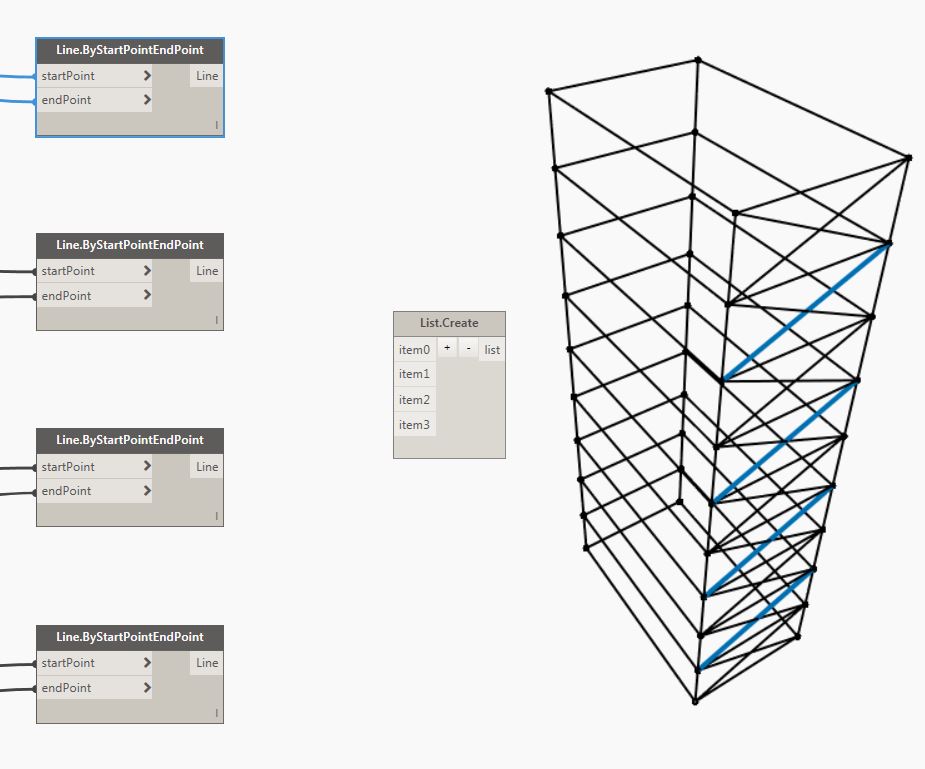
After that, we are ready to add the cross bracings.

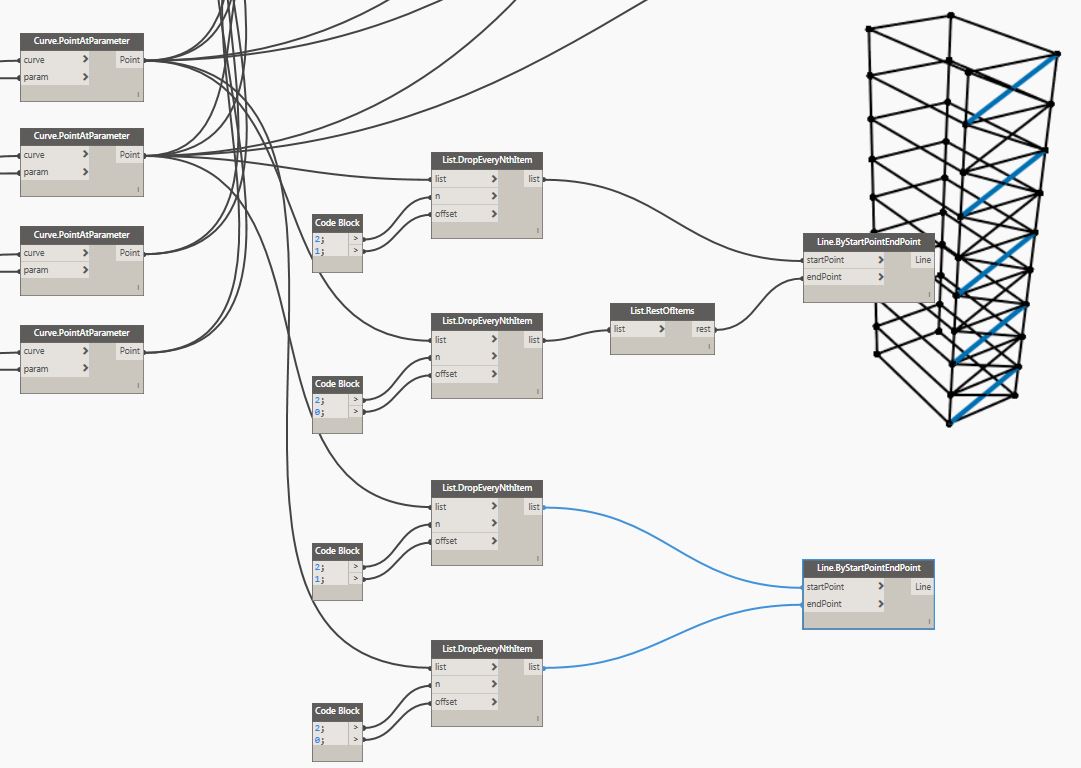
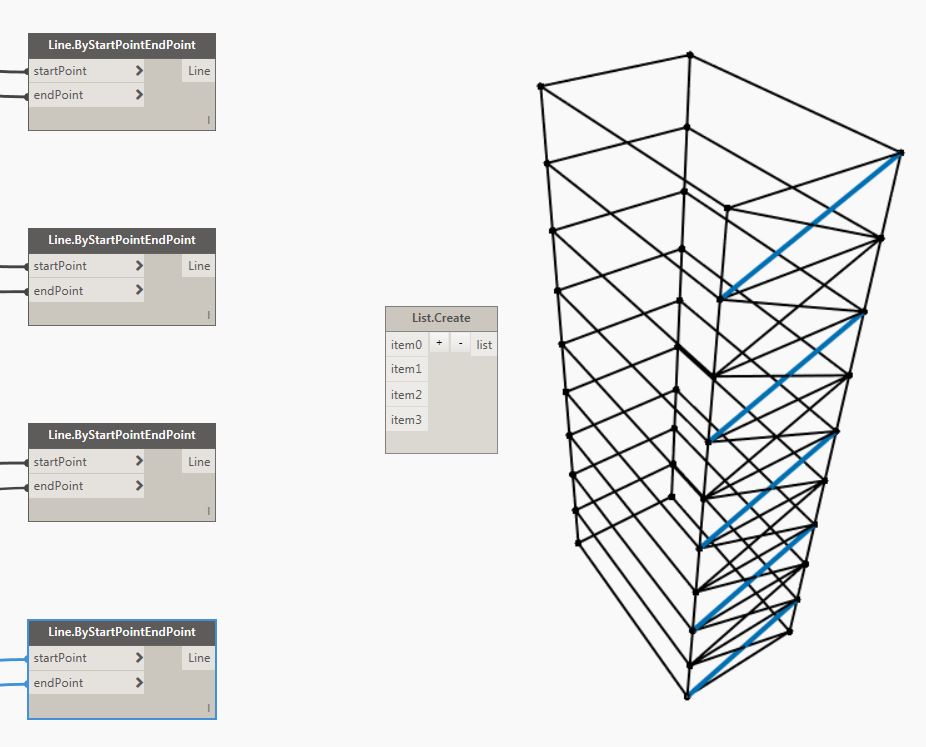
Then we will do the opposite side by starting the bracing from Column C02.
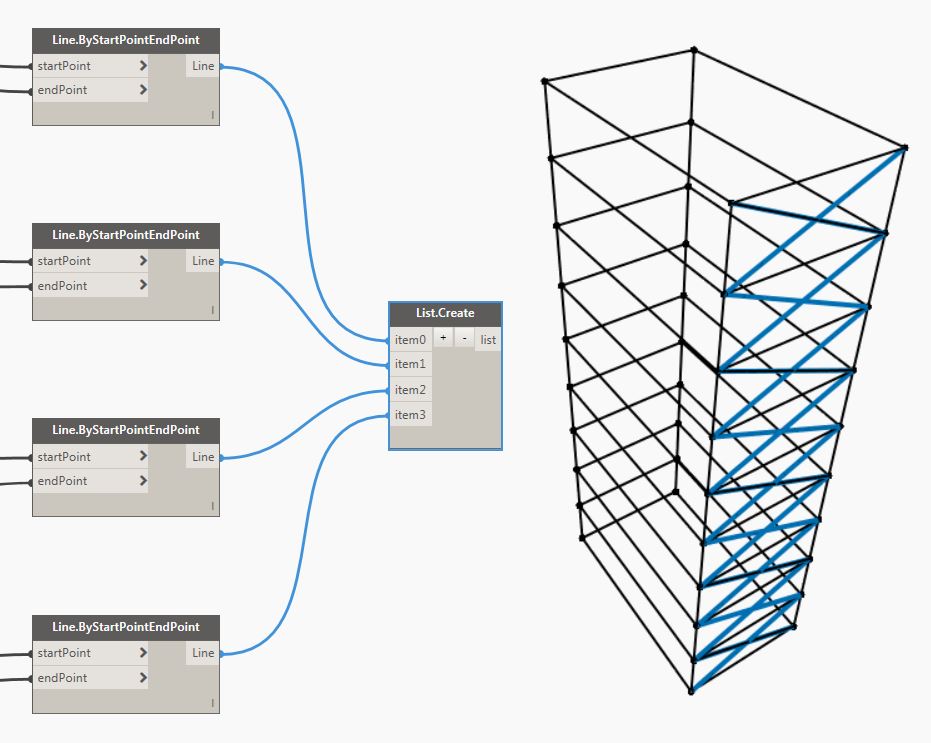
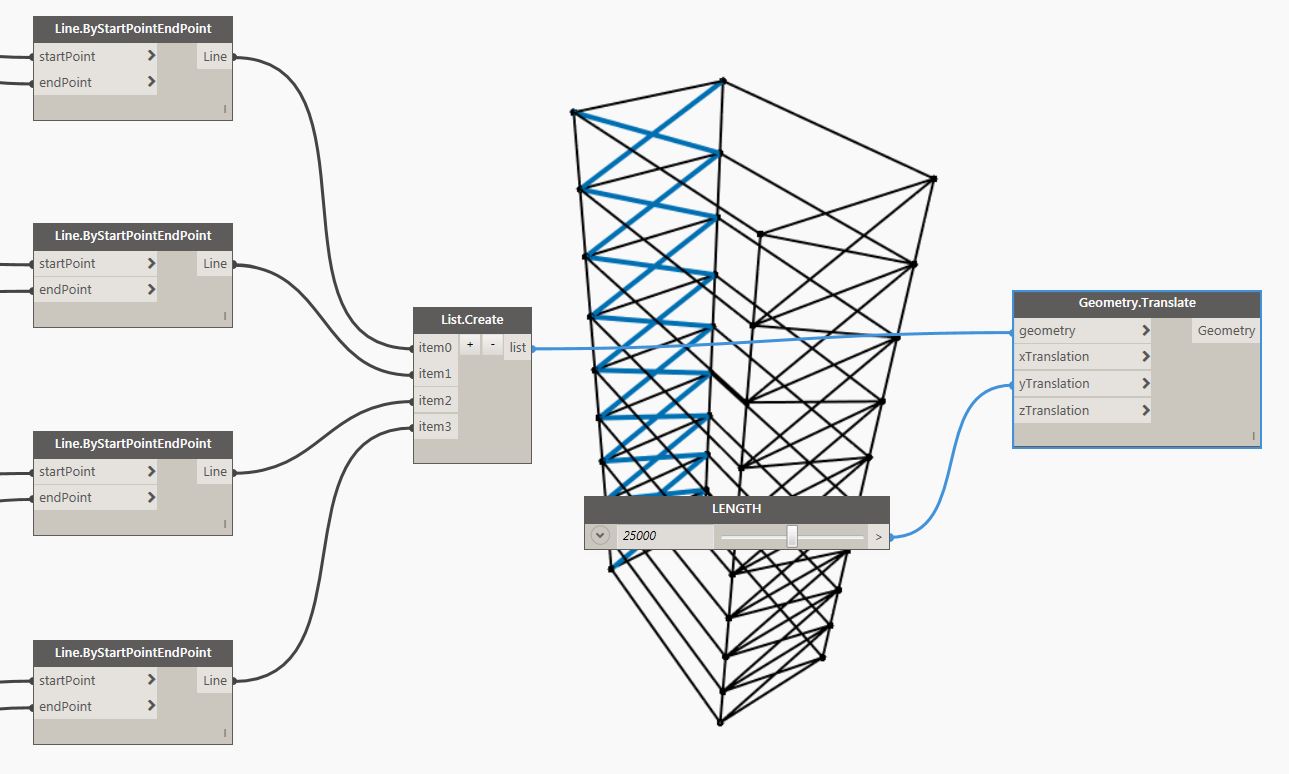
Now you can make a copy of this cross bracing to Y-Direction, which is our Length if you remember when we created the number slider.
Now it is completed, you can test it now by changing the length, width, height, and number of floors.
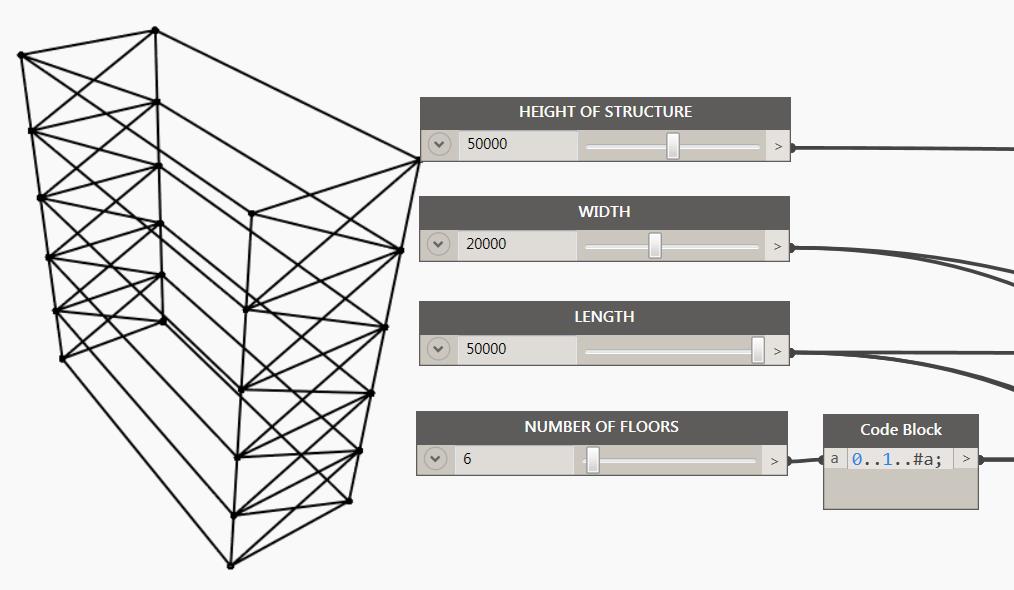
As you can see, it is now dynamic and you have the full control over the sizes.
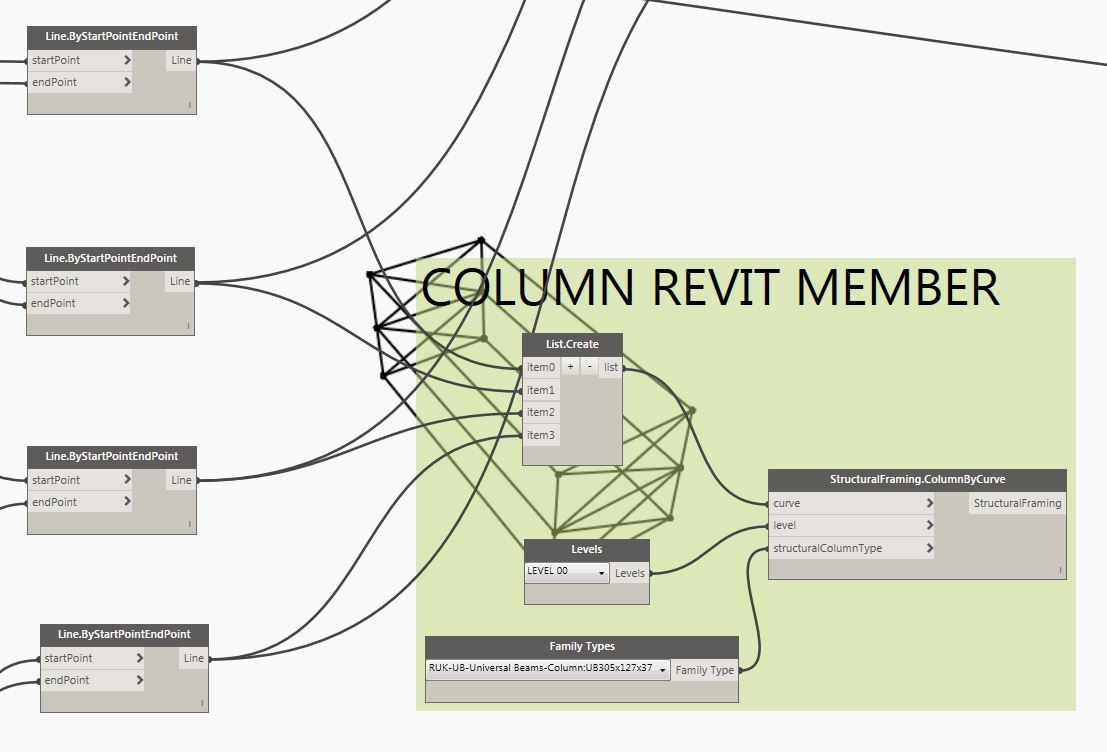
The final part would be assigning the Revit member elements.
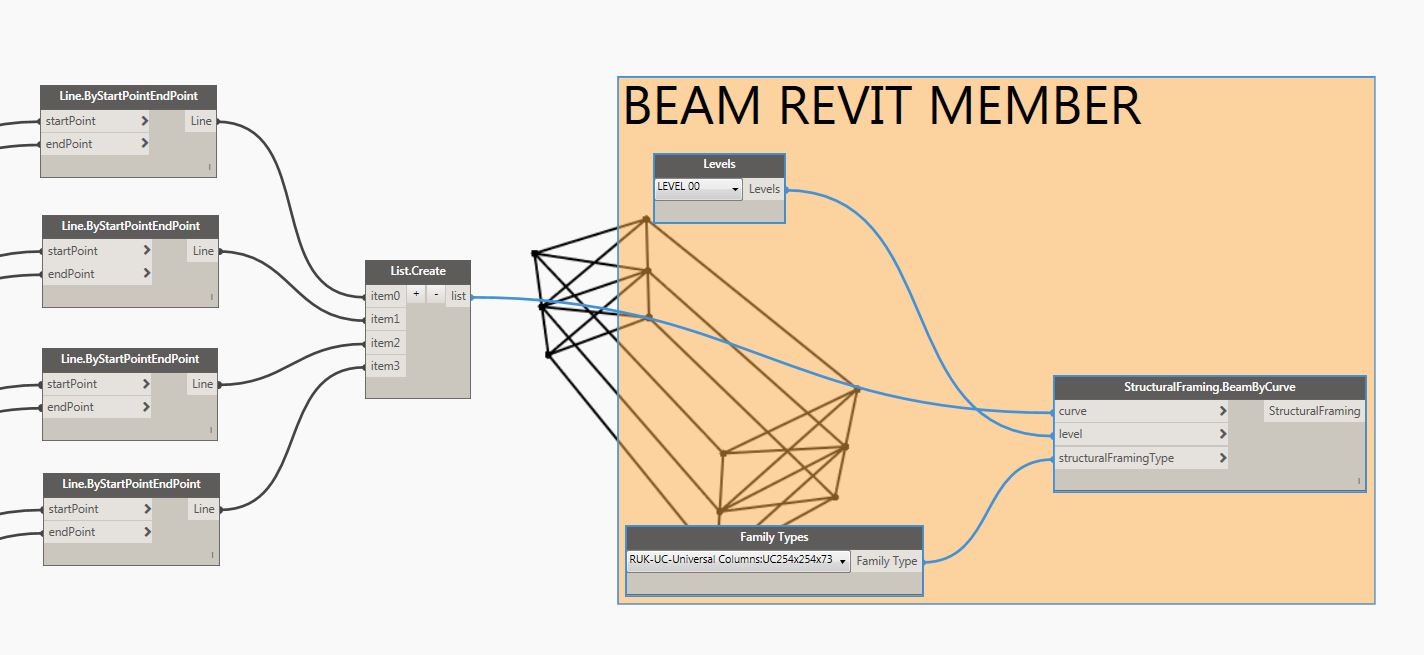
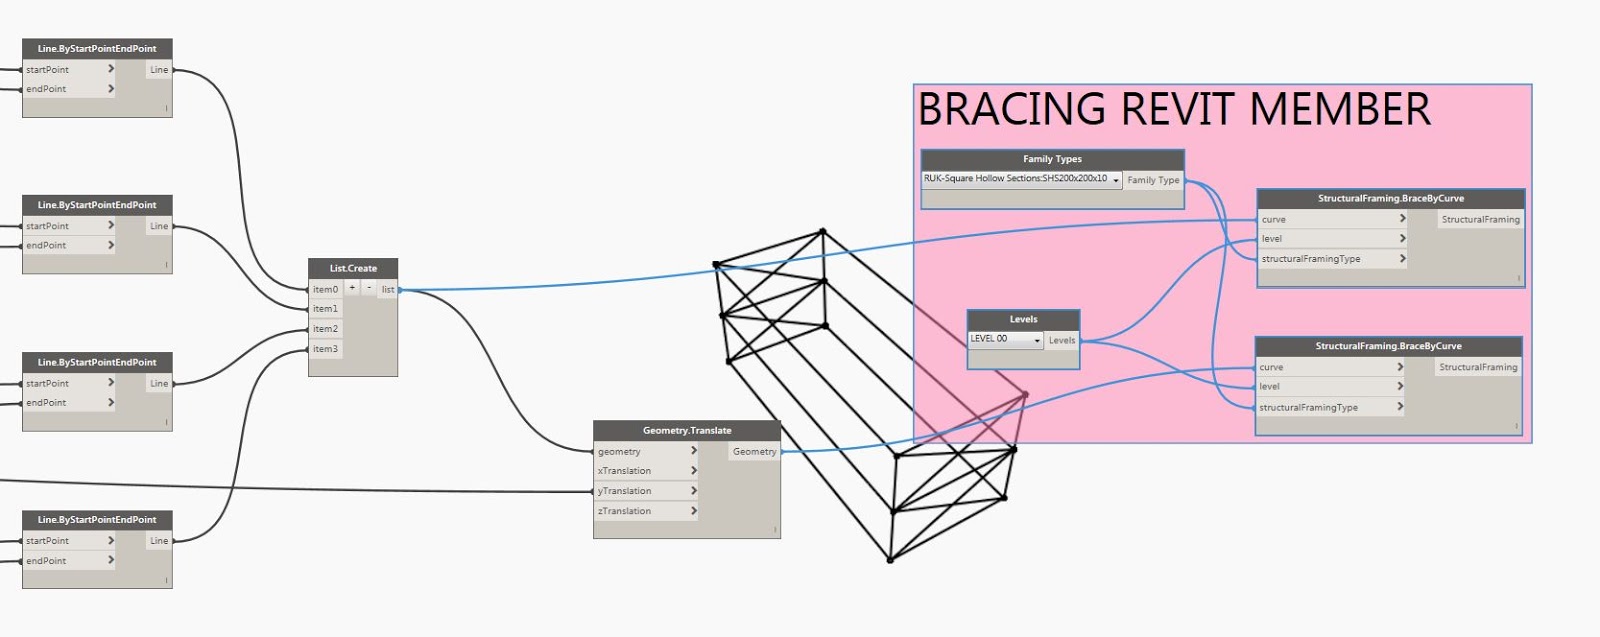
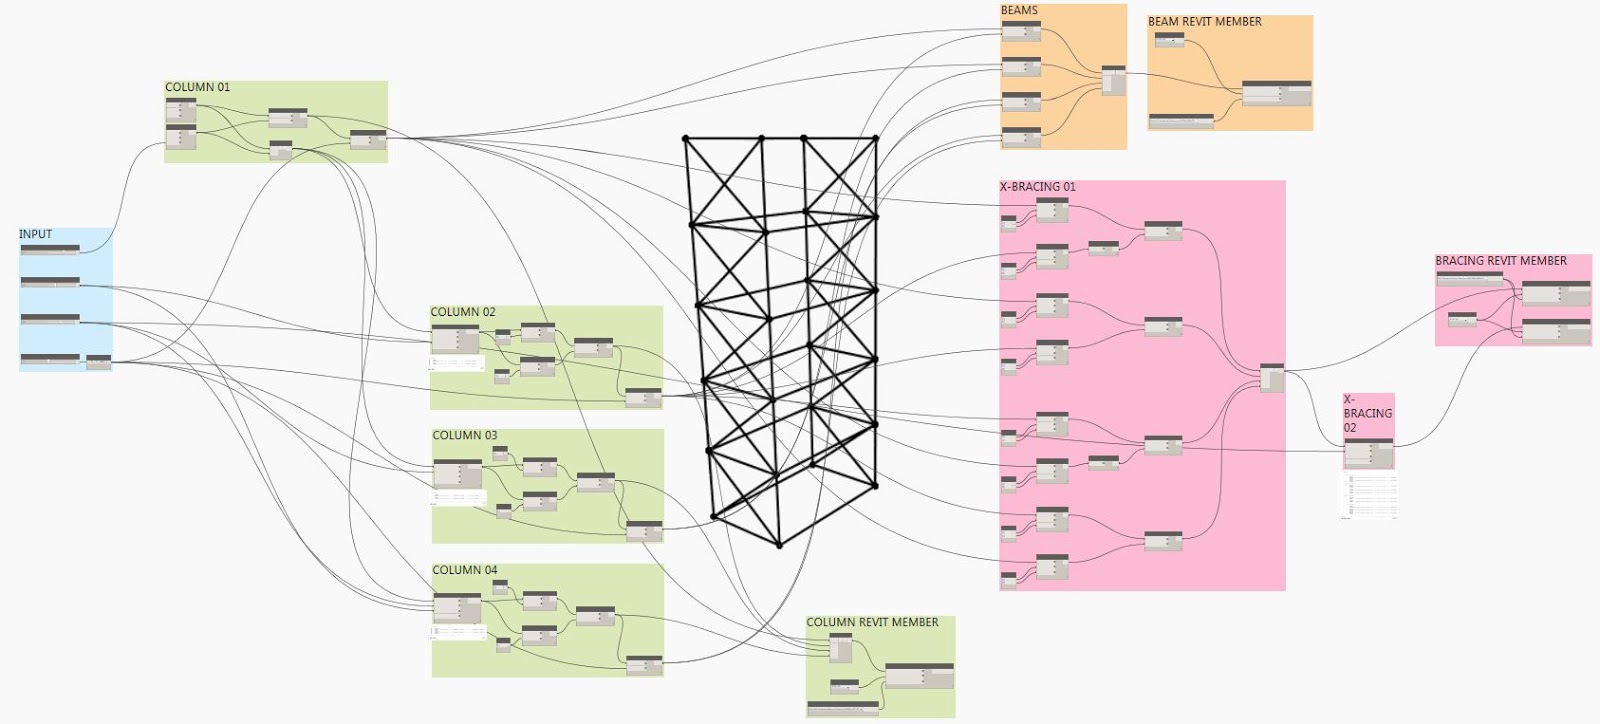
And here is the completed Dynamo graph:
I am aware that there are many ways to model this challenge in Dynamo. I do have another version but it is not completed yet. I would be happy to see your own version by commenting and posting your own version if you don’t mind.
Thank you for visiting my blog and I hope this little tutorial helps you in developing your Dynamo skills especially those beginners like me.
Unless you try
to do something beyond
what you have already mastered,
you will never grow.
Ralph Waldo Emerson
(1803 – 1882, American essayist, lecturer, and poet)
Have a great day!
Cheers,
Allan Cantos