Revit Dynamo PowerBI Workflow Video Recording – Part 2

Hello there. It’s me again, Allan Cantos. I trust you are well.

You have seen in my previous post the video recording that I did when I was preparing for my presentation for the 2018 BiLT Conference. I hope you don’t mind the accent (hahaha) but rather look at what you can get from that video recording.

If you missed watching that first part, I highly recommend that you go back to that video first before continuing watching this part 2 to get a better understanding of what happened in the first part.

Here is the link for the first part:

Revit Dynamo PowerBI Workflow Video Recording – Part 1

And here is the Part 2 recording:

As a correction, the video recording mentioned about using the latest Dynamo version installed in your machine if you have 2 or 3 versions installed. Actually, I have not tested this in Dynamo 2.x versions yet so it may or may not work. I suggest using Dynamo 1.x versions.

If you need a hard copy of this tutorial, you can download it from the links provided below. I hope you’ll support me in funding the expenses of running this website. It’s my personal online library and it will be yours too.

Using PayPal:

Revit-Dynamo-Power BI Guide ebook (PayPal)

Using Credit/Debit Card:

Revit-Dynamo-Power BI Guide ebook (Credit/Debit Card)

I hope you find this video tutorial helpful. Please leave your comment below if you have any questions.

Have a great day!

Cheers.

How to add your Power BI Dashboard to your BIM 360 Project Home Dashboard

Hello there, Allan Cantos here. I hope you are all well.

As a pre-requisite to this tutorial, I assumed you already have built your Power BI Dashboard that you would like to link to your BIM 360 Project Home Dashboard. If not yet, I would advise you to build one first then come back to this tutorial.

Alright, let’s get started.

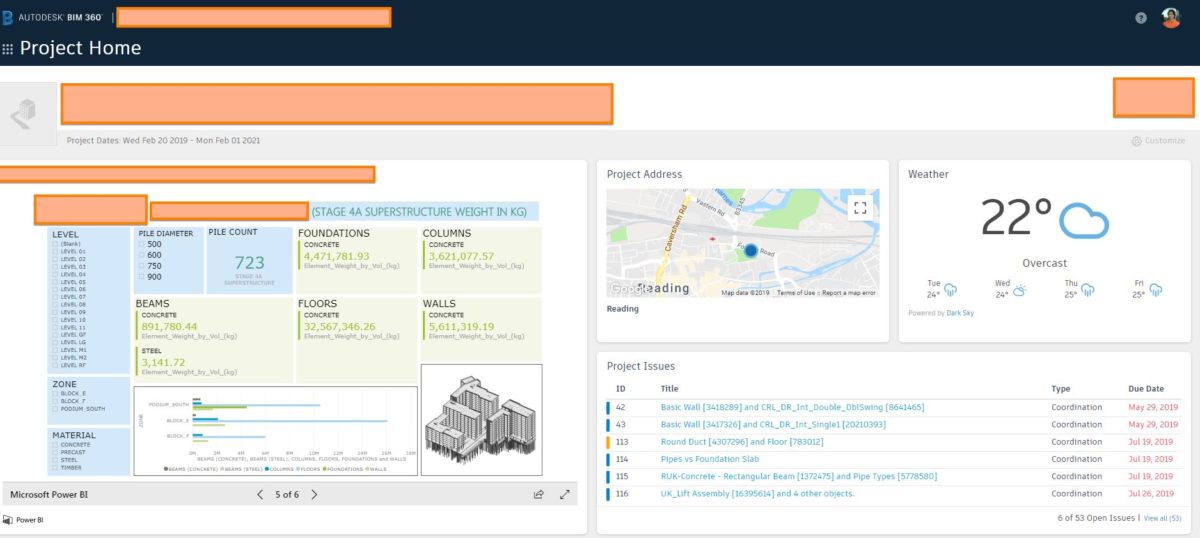
Here is what we are trying to achieve:

Before you can do modifications to the “Project Home” page, you must have as admin rights.

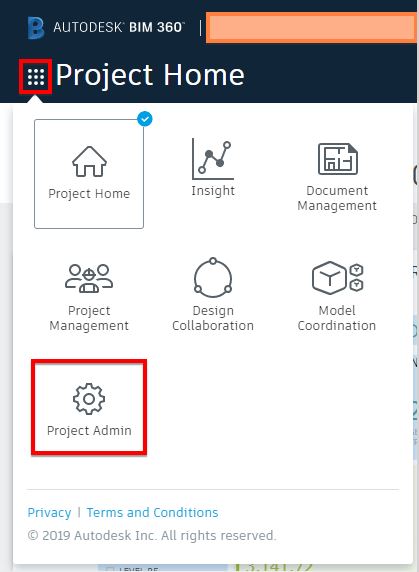
You can access the “Project Admin” page by clicking the “9-dots” located at the upper left-hand corner (just below the Autodesk BIM 360 logo).

And, once again, before you can modify the “Project Home” page, you must have a “Project Admin” rights.

Now, go back to the “Project Home” page and click the “Customize” setting icon that you’ll find at the upper right-hand side of your dashboard.

An now you are ready to add a new visualisation card. Click on Card Library.

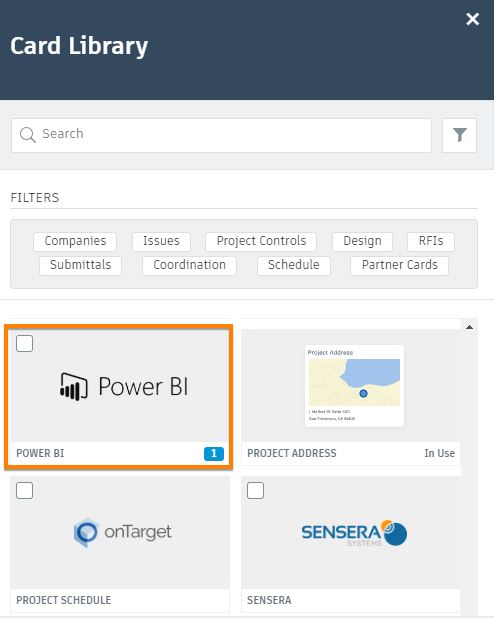
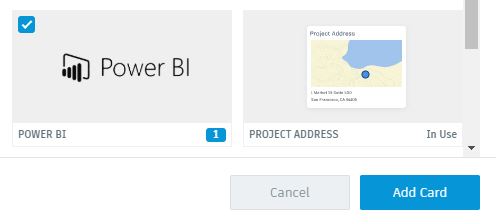
And from the “Card Library”, scroll down until you find the “Power BI”.

Select it and then click “Add Card”.

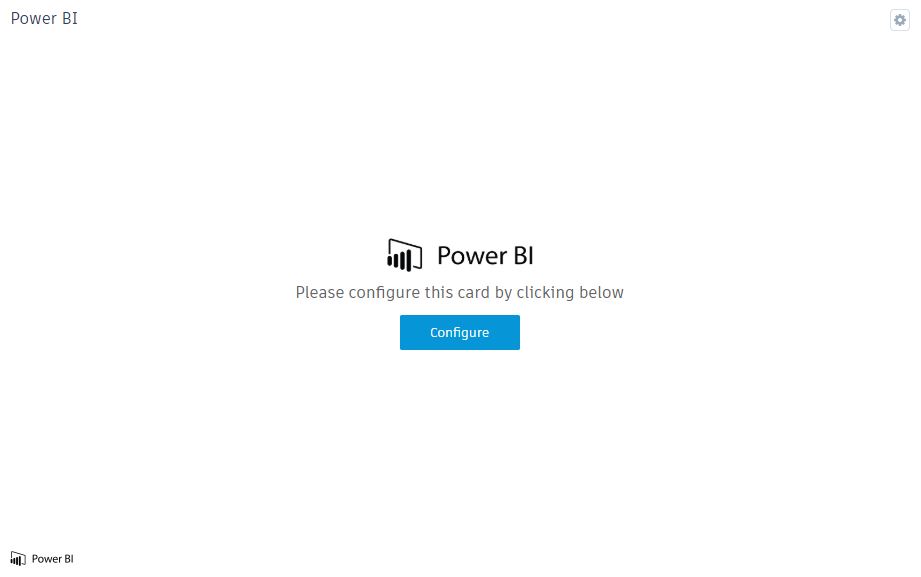
Click “Configure”

Next, log in to your Power BI account on your Chrome browser and open the Power BI report.

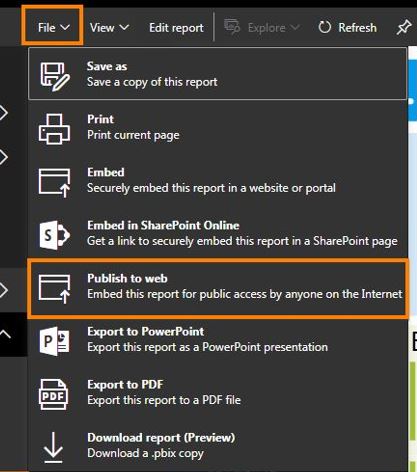
After that, select “File” and from the drop-down list, select “Publish to web”.

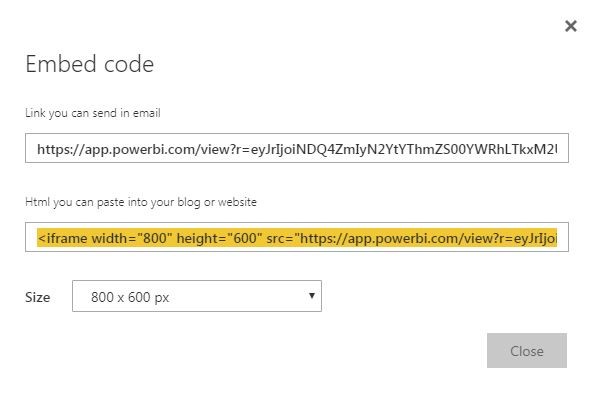
And this will give you the “Embed code”. Select the link highlighted in yellow below and hit CTRL-C to copy.

Go back to your BIM 360

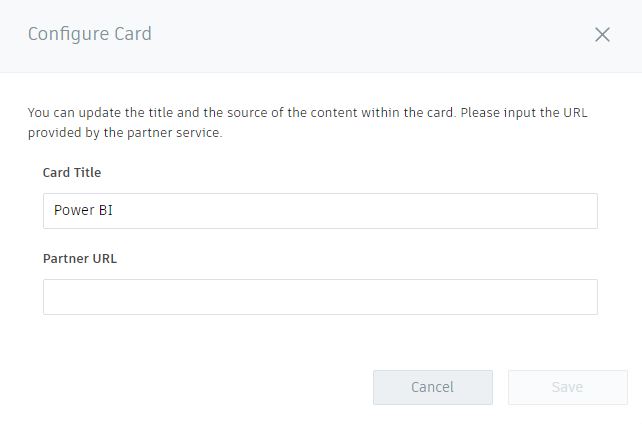
Give your Power BI “Card Title” a name then paste (CTRL-V) the link copied from the previous step to “Partner URL”. Make sure to delete the texts before https and the texts about frame border at the end of the pasted URL.

Click the “Save” button and you’ll now be able to see your Power BI dashboard from you BIM 360 Project Home page.

I hope you find this tutorial helpful. If you have any questions, please let me know by leaving your comments.

Have a great day!

Cheers!

BILT 2018 Statistics For Your Reference

Hello there! I trust you are well.

I did a quick Power BI visualization of BILT 2018 events statistics where I took part.

At the end of this article, you’ll find a link where you can view the results live in Power BI.

Please see images below for the results.

Here is the link for the list of BILT ASIA 2018 speakers who made it to the top 10: BILT ASIA – Winners and Grinners

Photos: BILT ASIA 2018

Here is the link for the list of BILT ANZ 2018 speakers who made it to the top 10: Winners and Grinners – BILT ANZ

Photos: BILT ANZ 2018

Here is the link for the list of BILT EUR 2018 speakers who made it to the top 10: Top 10 from BILT Europe 2018.

Photos: BILT Europe 2018

Congratulations once again to those speakers who made it to top 10.

Once again, you can view the statistics result in Power BI by submitting your few details below:

    Have a great day

    Cheers,

    Allan Cantos EngTech MICE

    BSc Civil Engineer / Principal Structural Technician

    Positive SSL