Reinforcement Intent: How do you normally do it using Revit?

Hi! How are you doing? I trust you are well.

Today I’ll open a discussion for all Structural Technicians about how you normally create drawings for reinforcement intent using Revit. I believe each and every structural technician has their own view on how to create drawings to show the reinforcement intent. Many years ago, I worked in a contractor company where I provided very detailed information for reinforcement for each individual element. See few samples of shop drawings below which I’ve done in AutoCAD and Revit wasn’t available during those years yet.
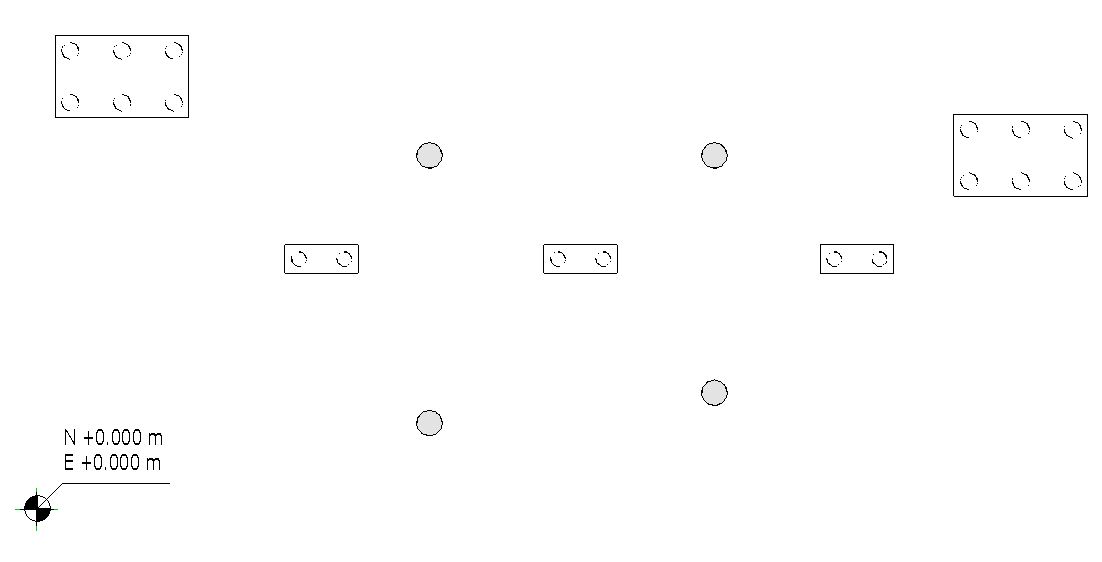
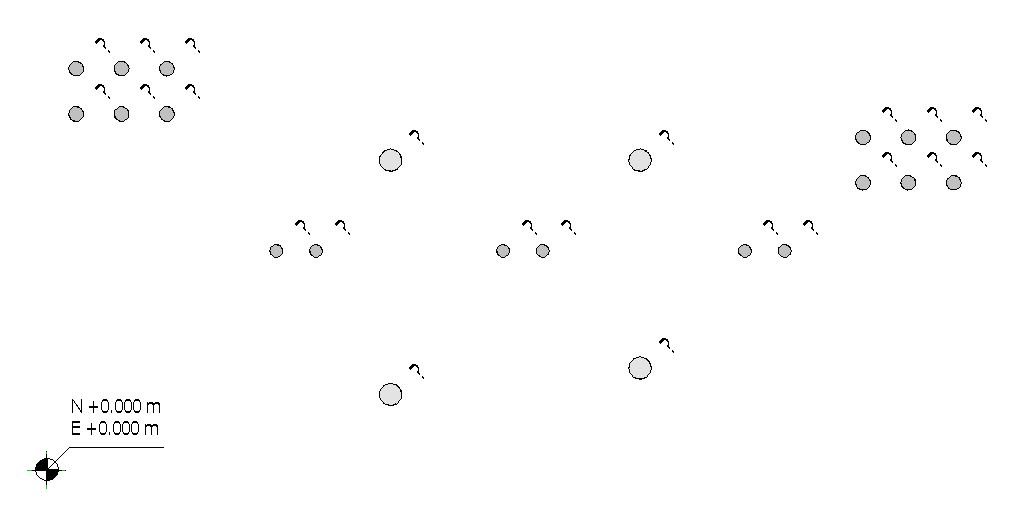
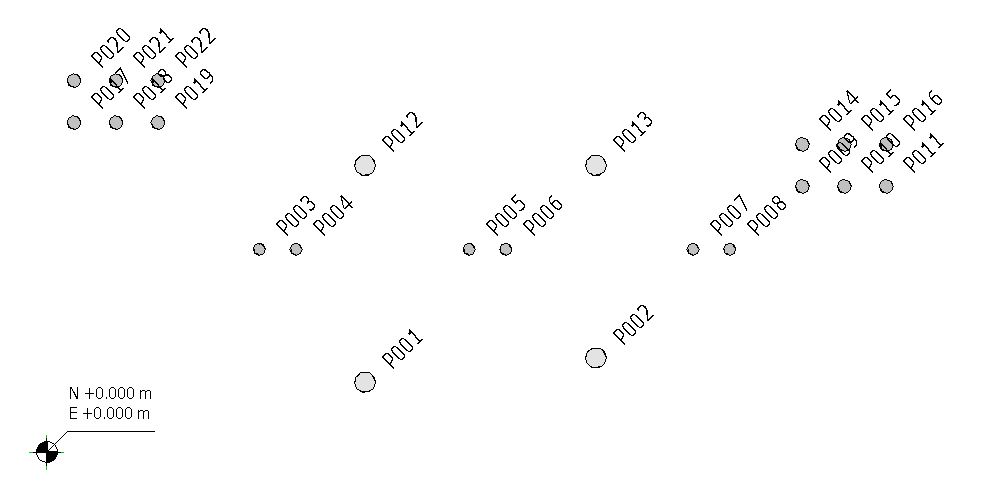
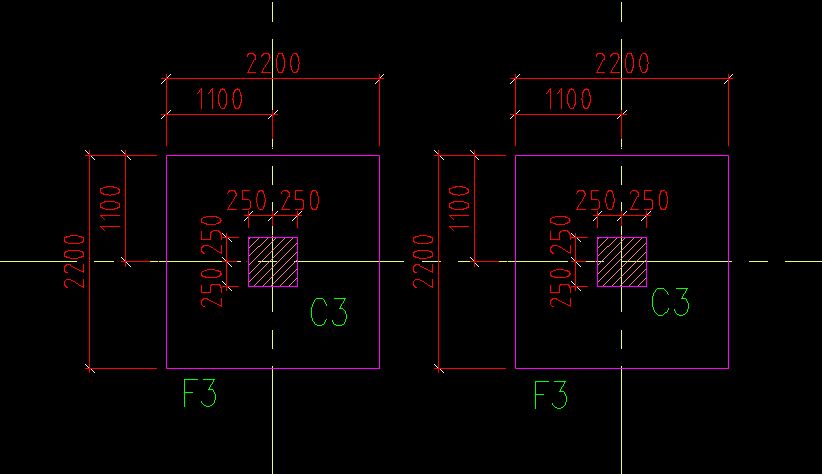
Setting out plan:

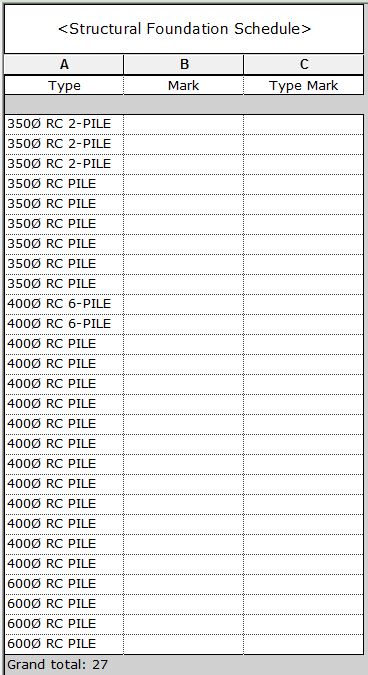
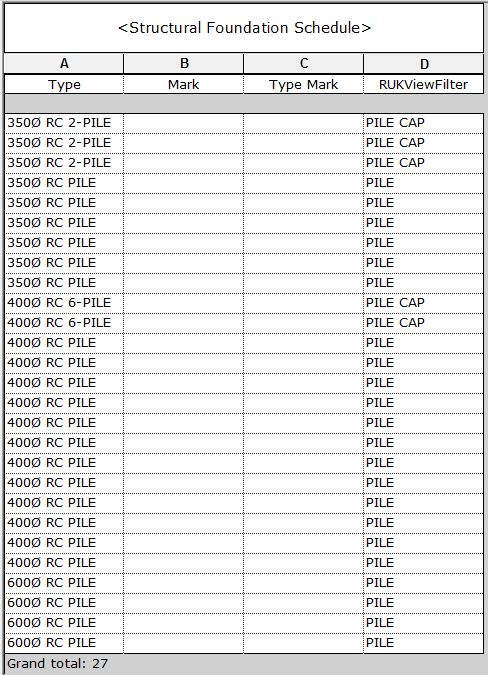
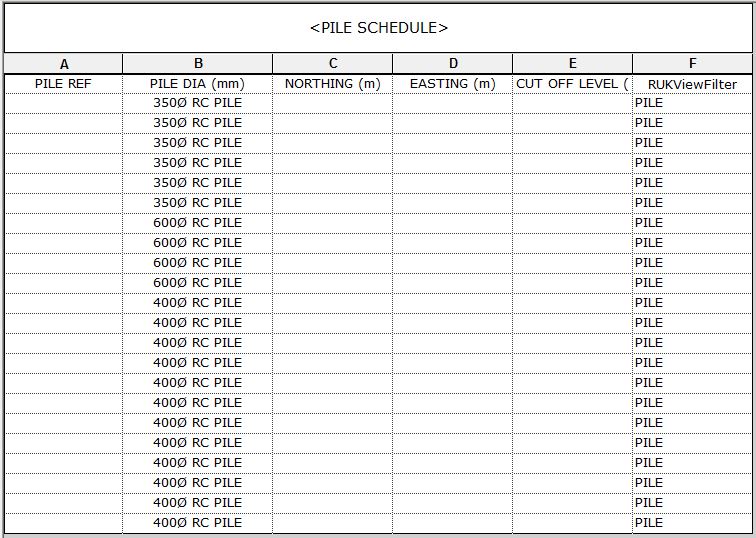
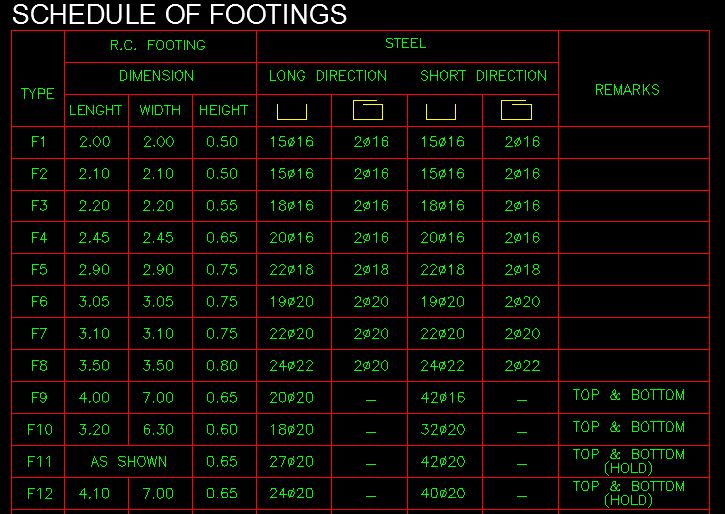
Schedule of footings:

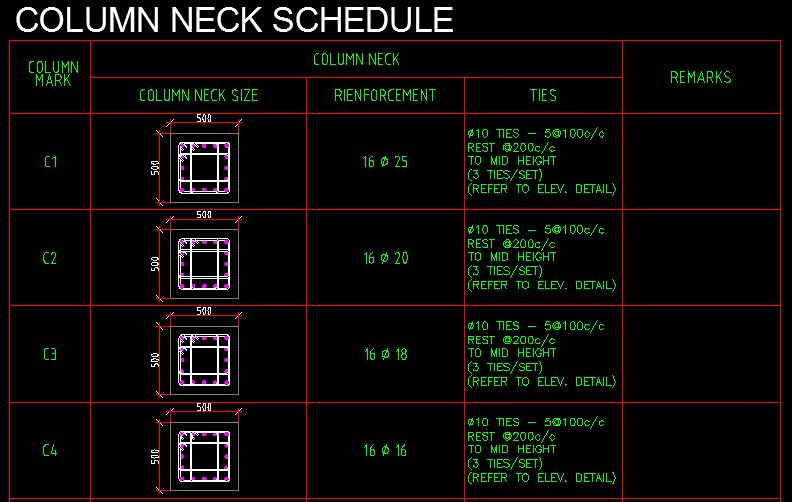
Column Neck Schedule:

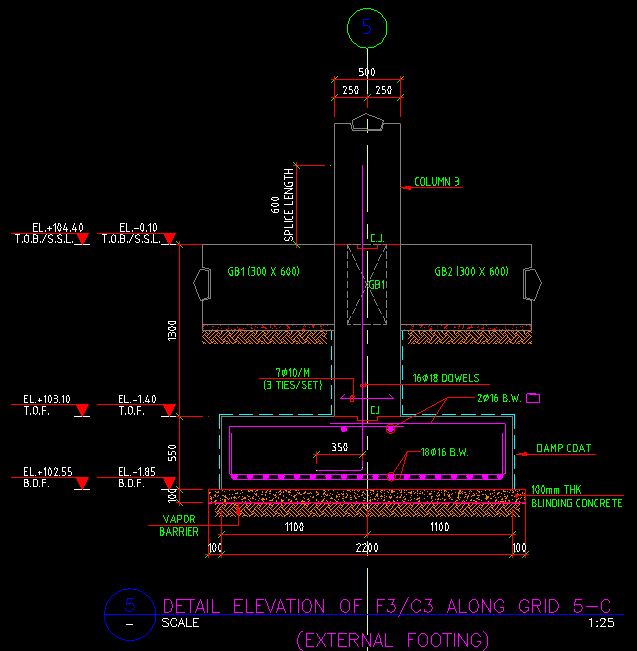
Detailed foundation reinforcement section:

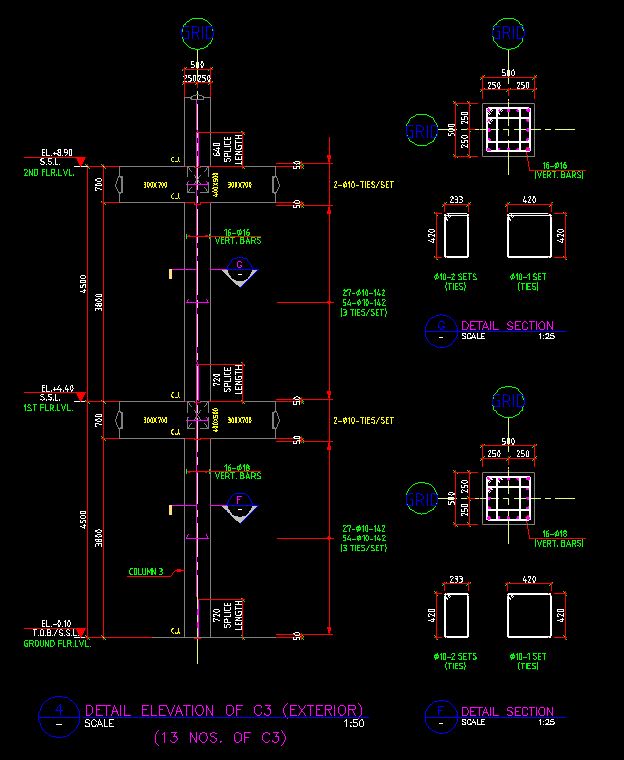
Detailed column reinforcement section:

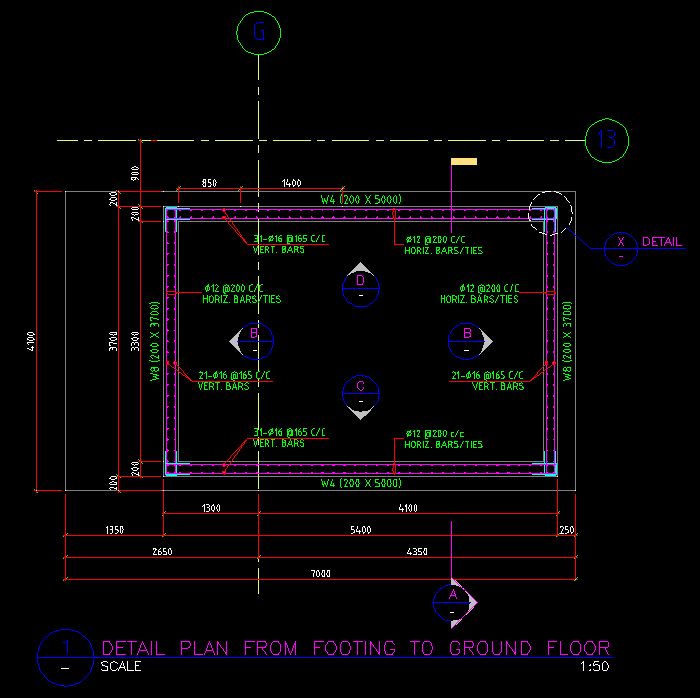
Wall plan from footing to the ground floor:

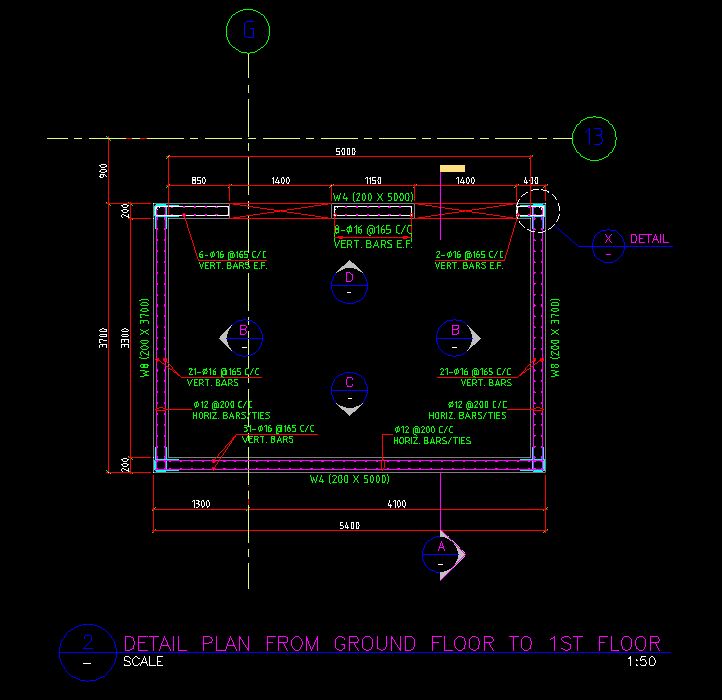
Wall plan from the ground floor to first floor:

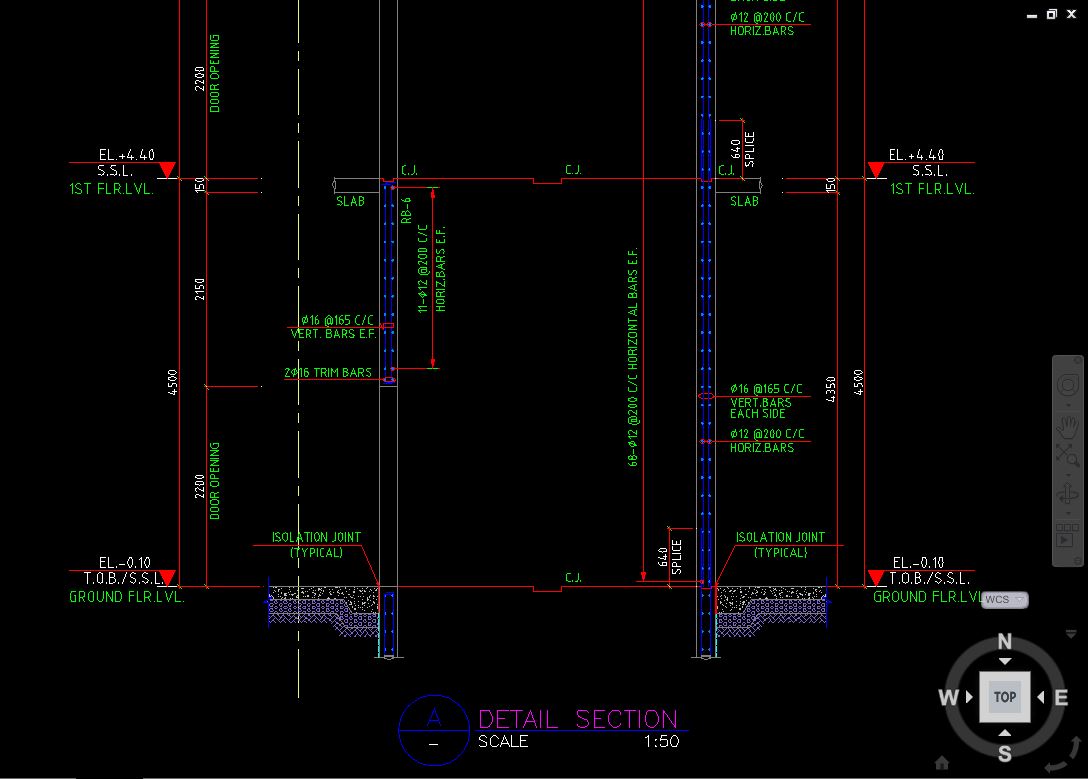
Wall detail section:

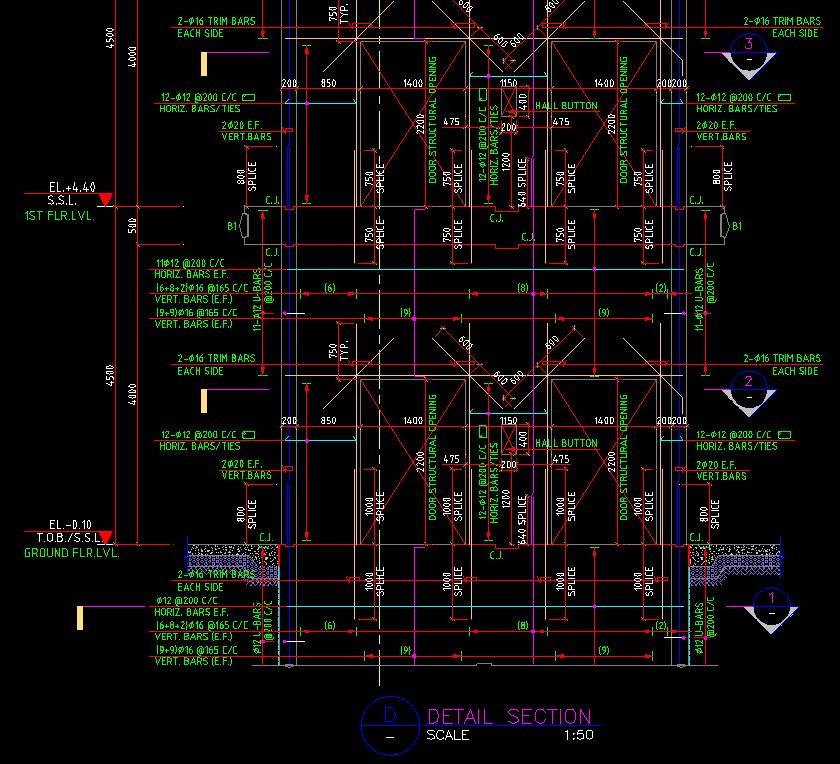
Detailed wall reinforcement elevation:

Have you done shop drawings before? If you are looking for someone to do shop drawings, please let me know. Anyway, moving forward, we now have Revit which makes it easy for us to develop plans, sections, elevations, and details. Any updates you do, say for instance moving the door opening from one location to another on the plan, will also update your wall elevations and this saves time for you to actually re-draw on your wall elevation the new location of the door opening.

The thing is, I got involved in a project where I am asked to provide reinforcement intent. I want to share with you my way of doing it and if you think there should be a much better way of presenting reinforcement intent, please don’t hesitate to share your view. I want to learn from you and I hope you don’t mind sharing your own view on how to standardize the reinforcement intent presentation on sheets and how do you normally prepare it? Perhaps you could send me a sample of your work and what you share to me will be highly appreciated.

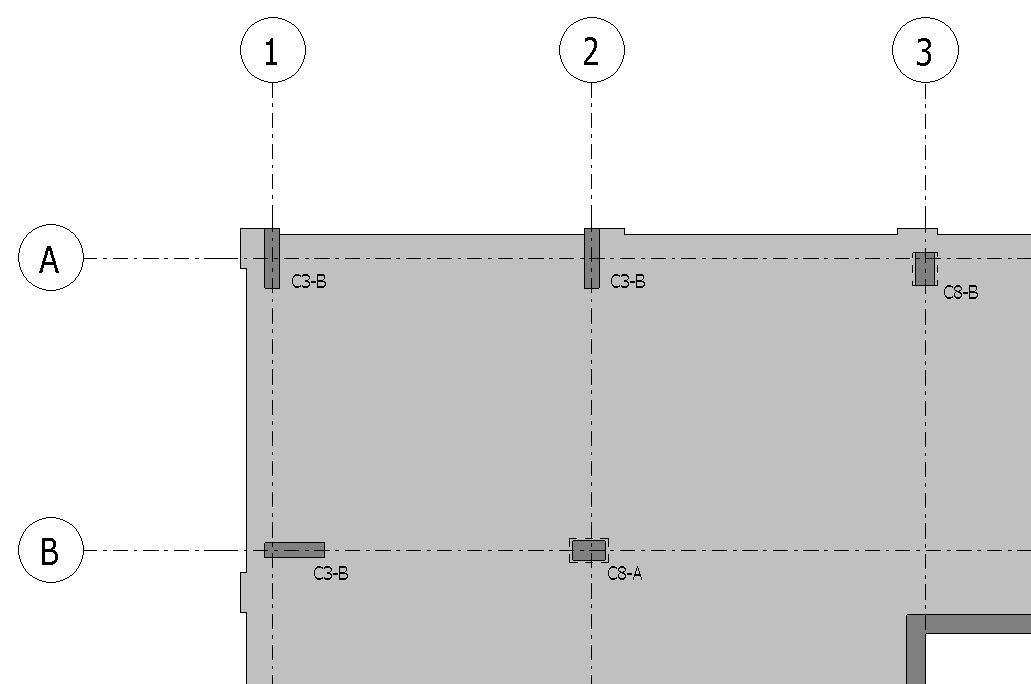
I’ve seen some drawings that provided tags on the plan similar to the one below.

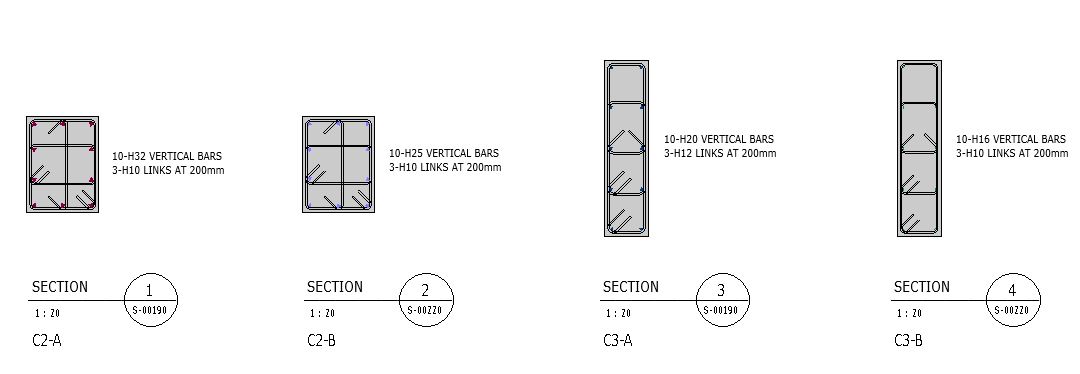
And another sheet where all the sections showing the reinforcement distribution are drawn similar to the one showed below.

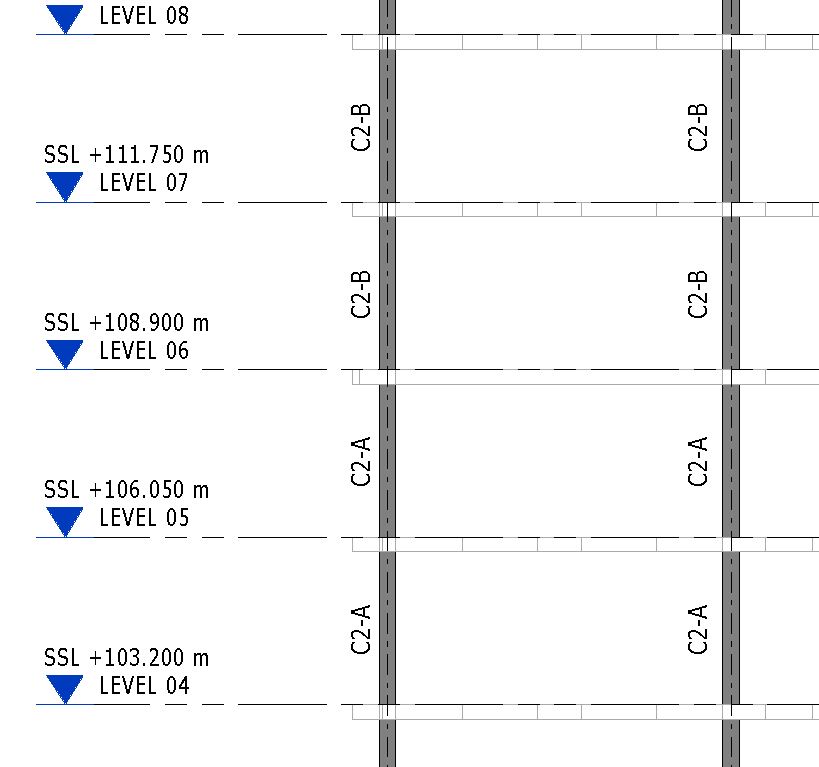
All my columns in the project I’m currently working on can be covered by creating sections. In this way I’ll see quickly at which level the vertical reinforcements will change and with that in mind, I no longer need to produce plans similar to the one above.

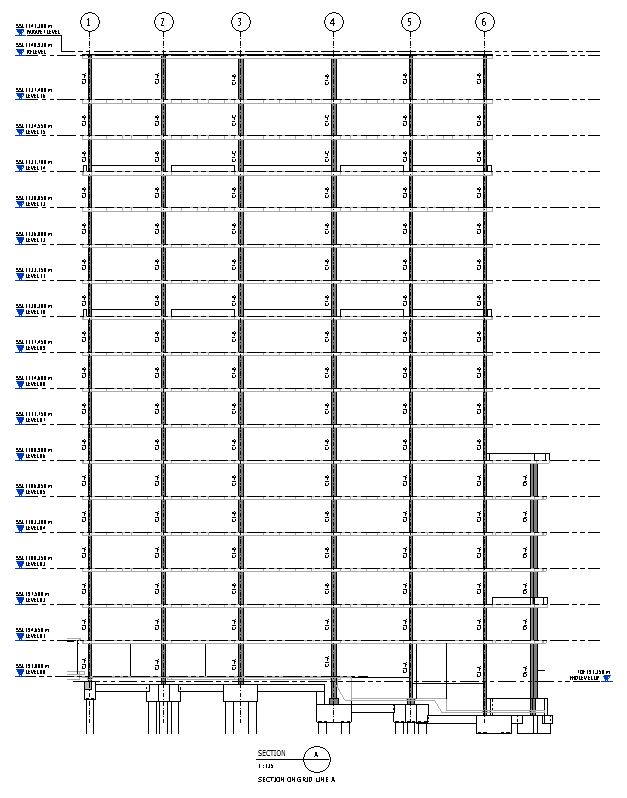
Here is one of the sections showing some member reference tags.

Let me have a closer look.

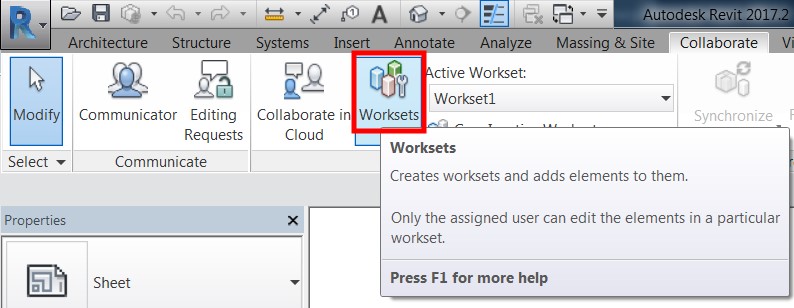
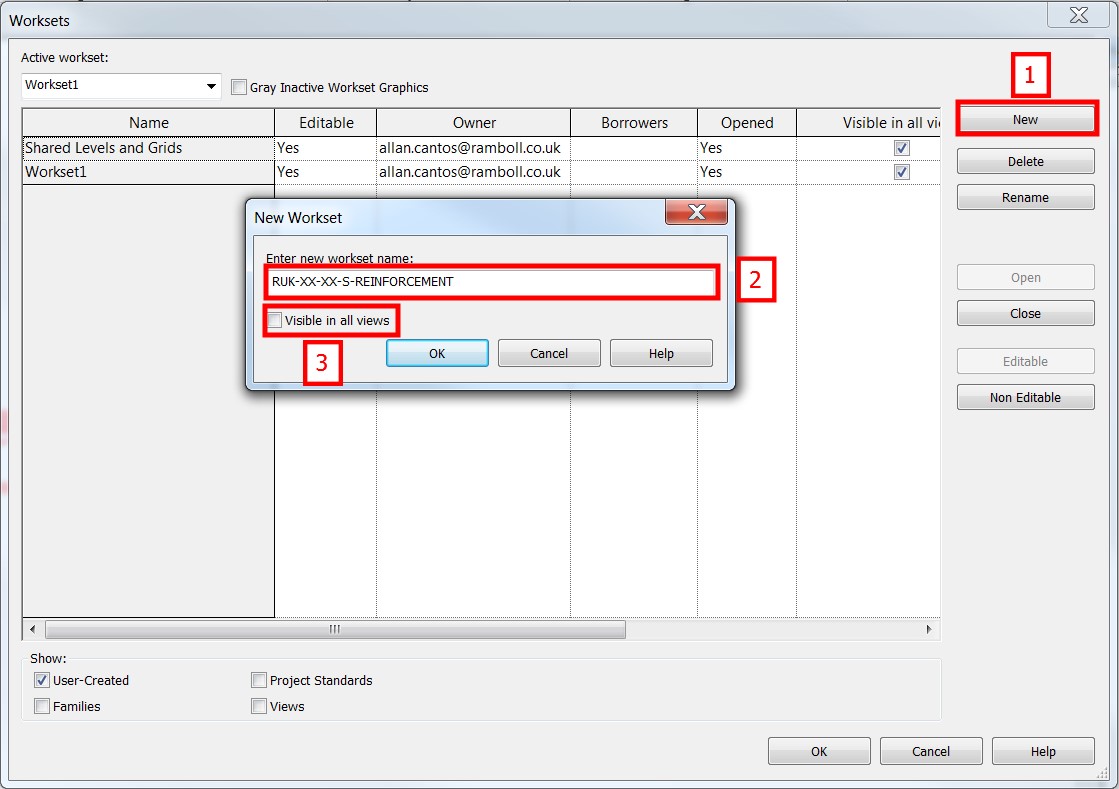
Now, here is my procedure. I’ll begin by creating a “Workset” for my reinforcement and I want to make sure that the “Visible in all views” tick box is unticked. In this way, I can only turn this Workset “ON” to views where I want my reinforcement to be shown. The Workset naming convention should follow your company standard.

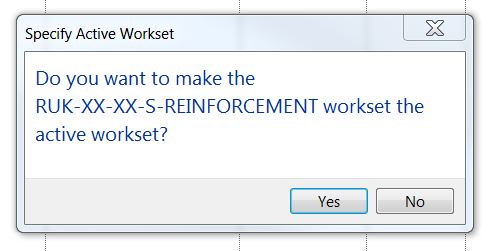
Then make that workset an active workset by selecting the “Yes” button.

Here is what you’ll see as default settings on your view template.

Next, I’ll create a view template or duplicate one that I already have and configure it to have the Workset for the reinforcement visible.

Then I’ll start in duplicating my floor level and assign the newly created view template.

Next is to create scope boxes and name the scope boxes accordingly.

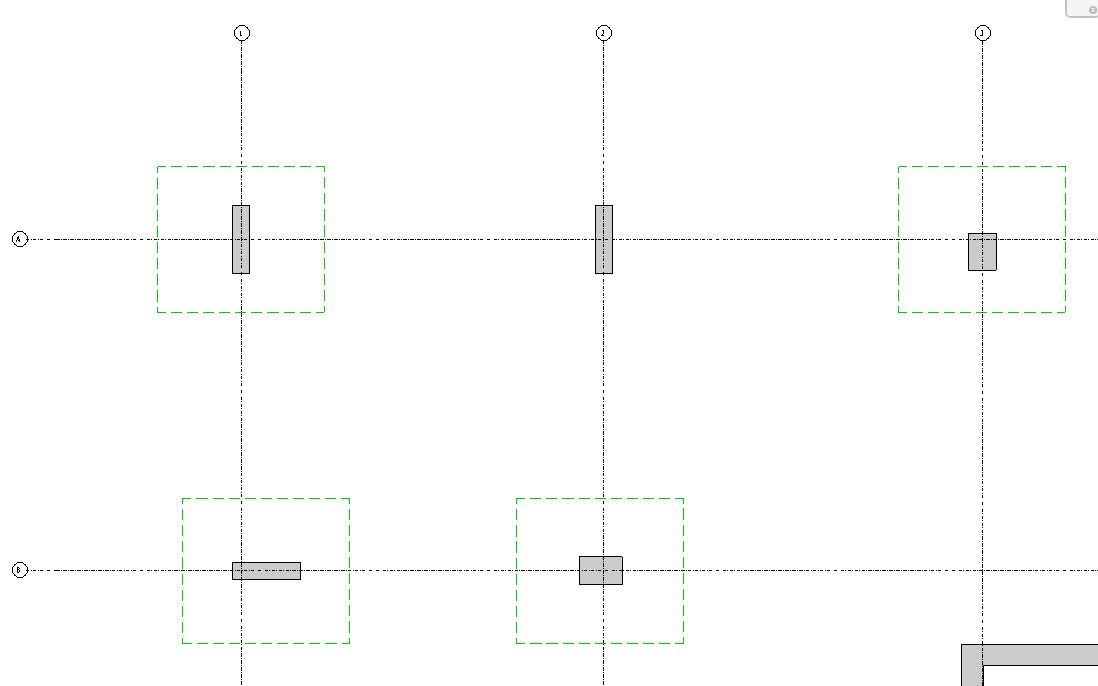
Here is where you will apply the scope boxes created.

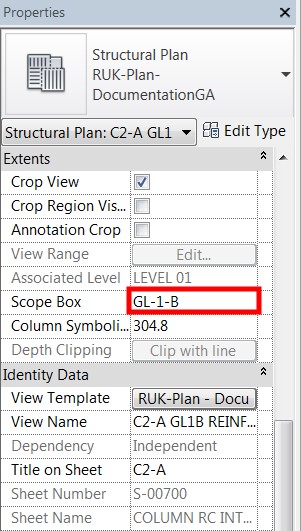
With this scope box selected, I am looking at my column at Gridline 1-B and I will have the view below. I configure my “View Range” to have it in the middle of the column so I won’t see beams and slabs for this exercise.

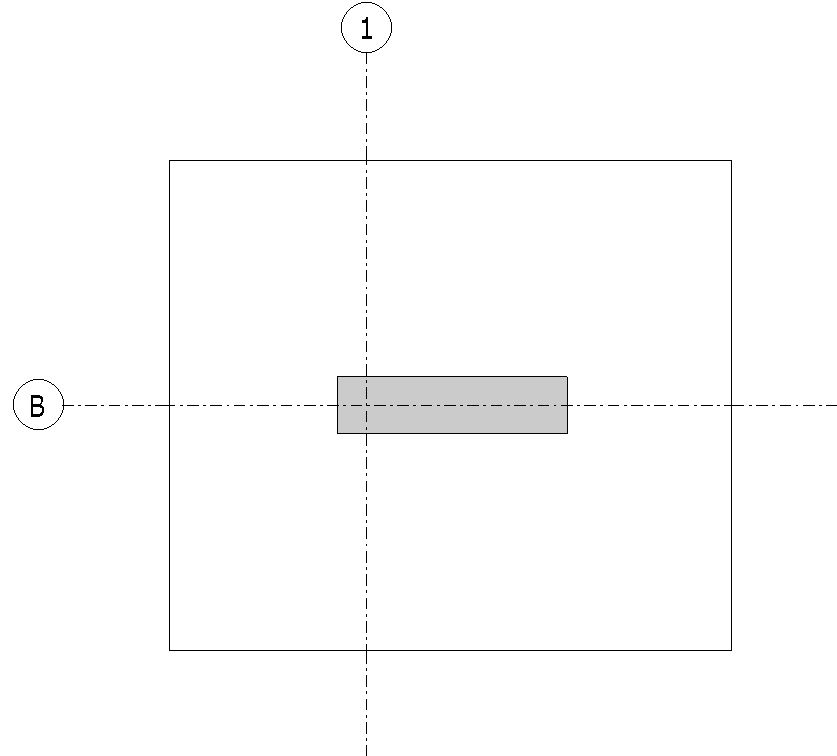
Next, I’ll hide the crop region and the gridlines and start tracing my reinforcement.

The question now is how they are actually drawn?  Some of you may not be taking advantage of Extensions tools that we have on Revit. There is a quick way to draw these reinforcements only if you know the right tools to use. I’ve seen some technicians creating the reinforcement using detail lines. For this exercise, we will be using the Revit Column Reinforcement Extensions plug-in since I am looking at the column which is a 3D element.

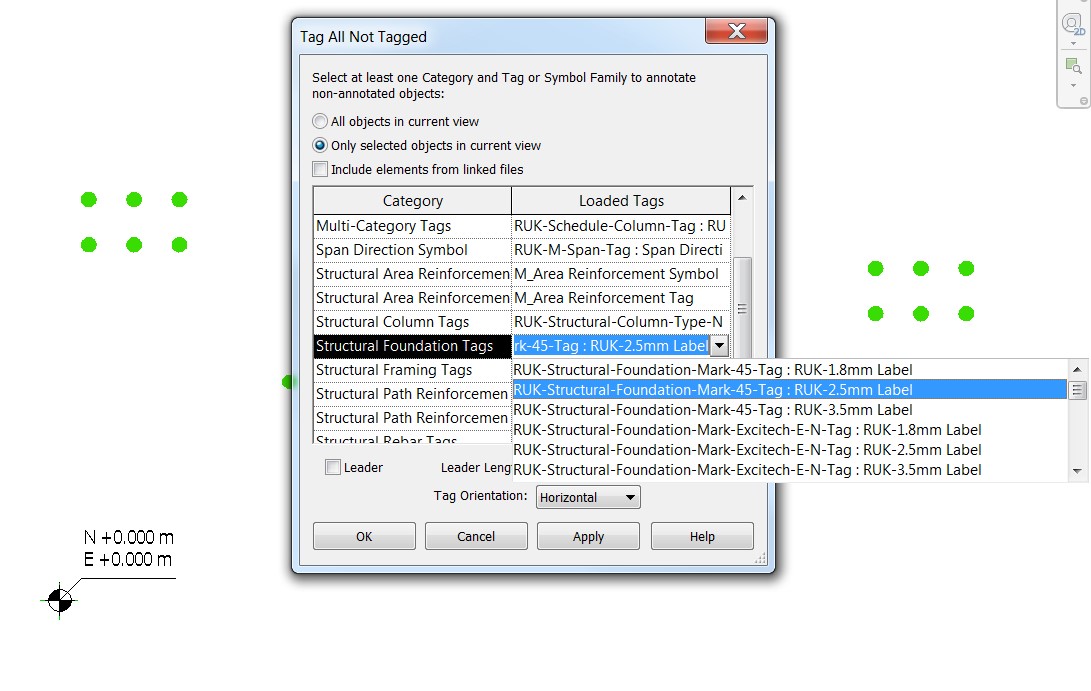
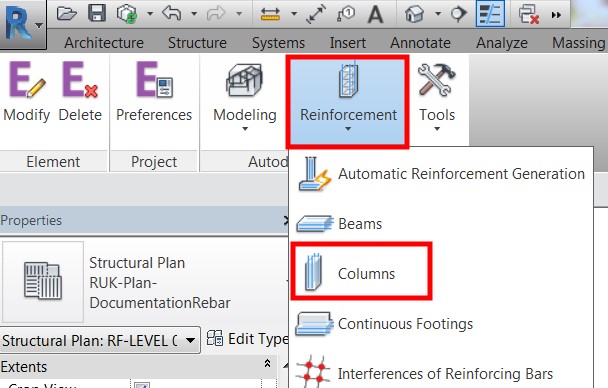
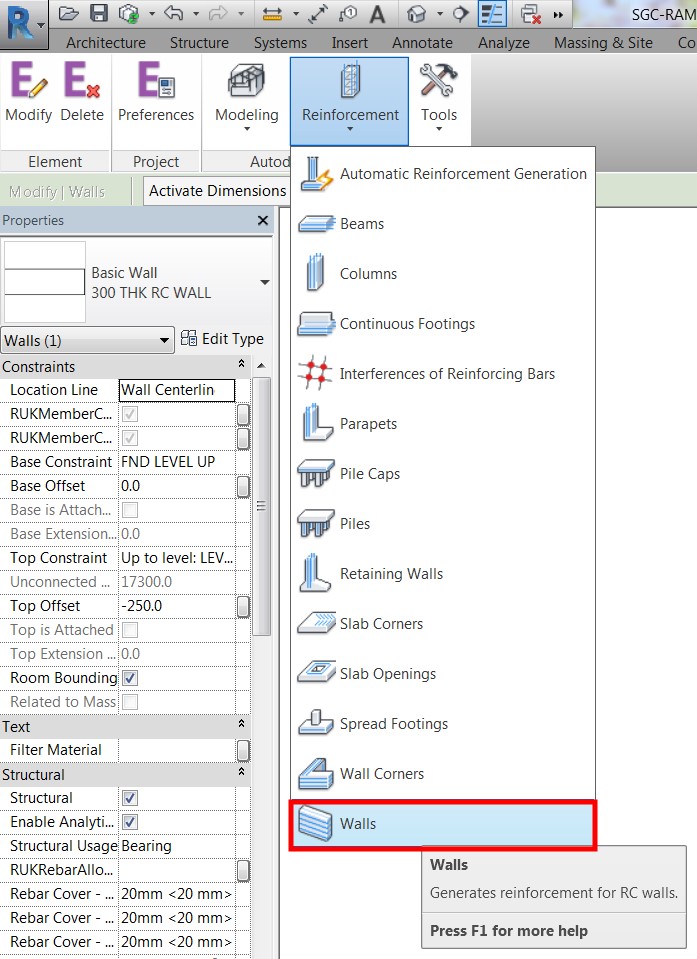
To start with, make sure the column is selected then look for the “Extensions” on the “Menu” options then under “Autodesk Revit Extensions”, choose “Reinforcement – Columns”.

Revit will automatically detect the geometry properties of the column so you don’t have to worry about this. However, keep mind of some settings to make sure they are right.

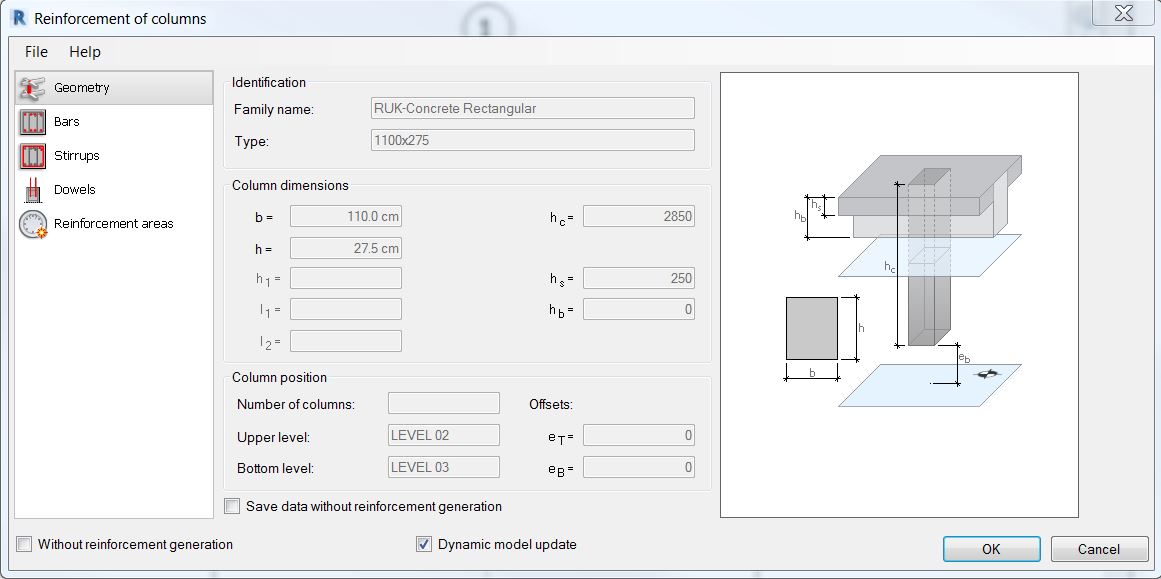
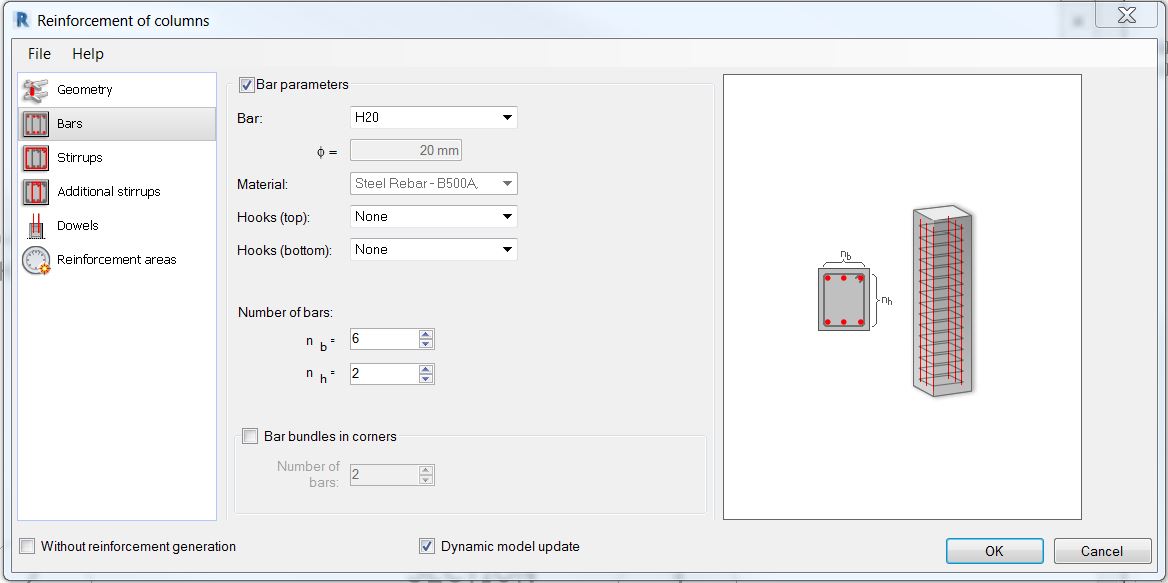
Next step is to specify the vertical bars. Other settings are self-explanatory anyway.

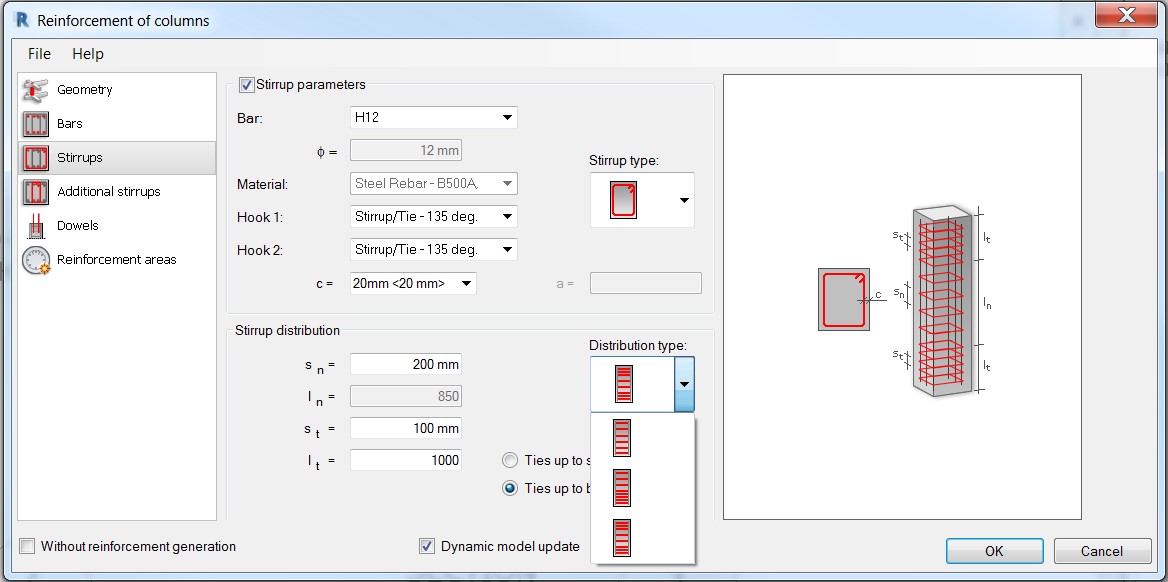
Next, move to “Stirrups” or other calls it “ties” and specify the desired stirrups bar diameter. Select the desired stirrup type and distribution type from the drop-down selection menu. The rest of the settings are based on the design.

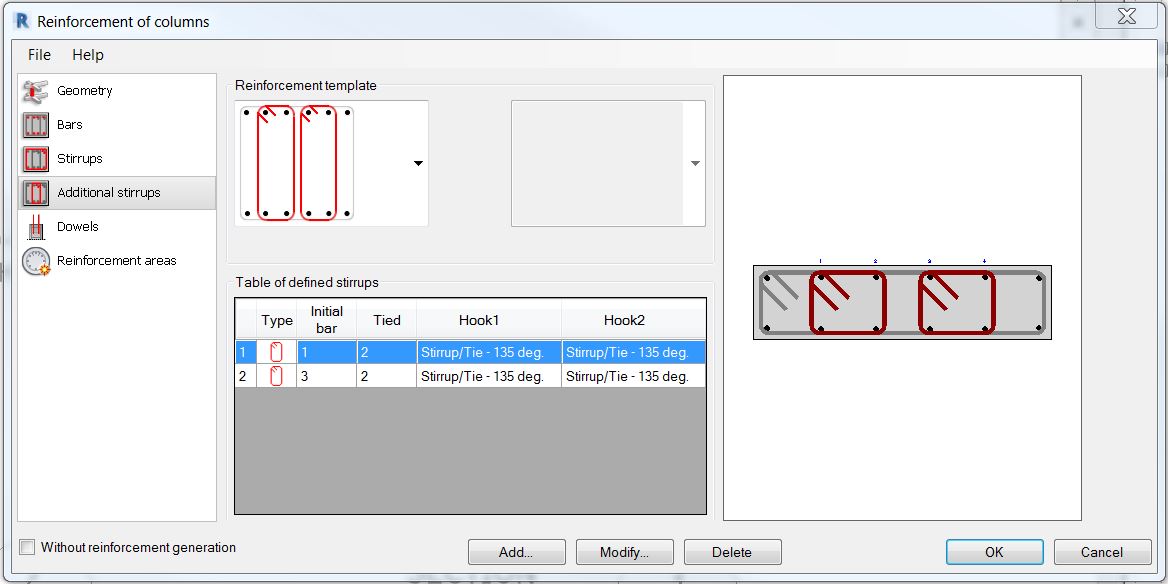
And finally, jump to “Additional stirrups” where you can choose from a given “Reinforcement template” the additional stirrups arrangement that matches your design.

I don’t have to worry about the next two options, “Dowels” and “Reinforcement areas”

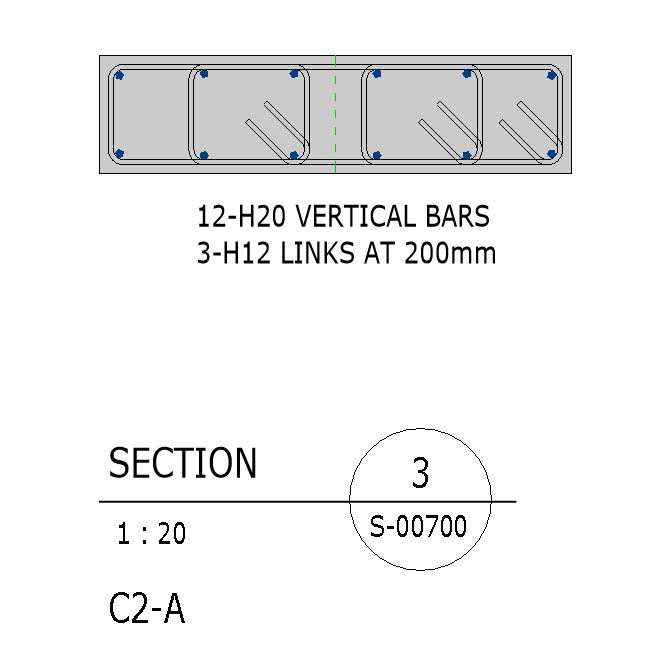
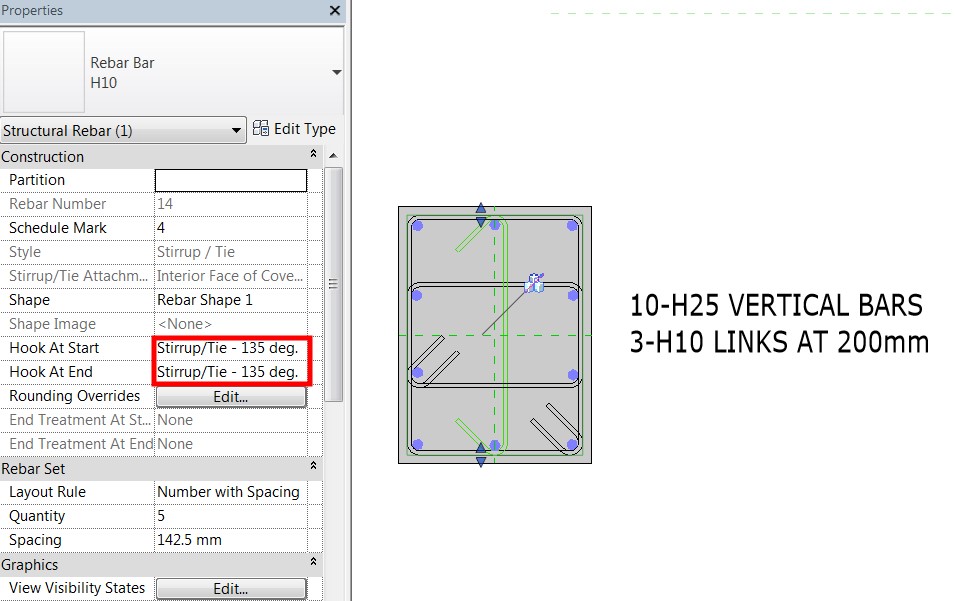
Next, add a bit of information, place it on the sheet and I’ll have something like the one below.

By the way, there will be some instances where you want to change the hook orientation and it can be done on the “Properties” tab.

That should be it for the column. How about the walls? I’ll do a similar thing using Revit Extension.

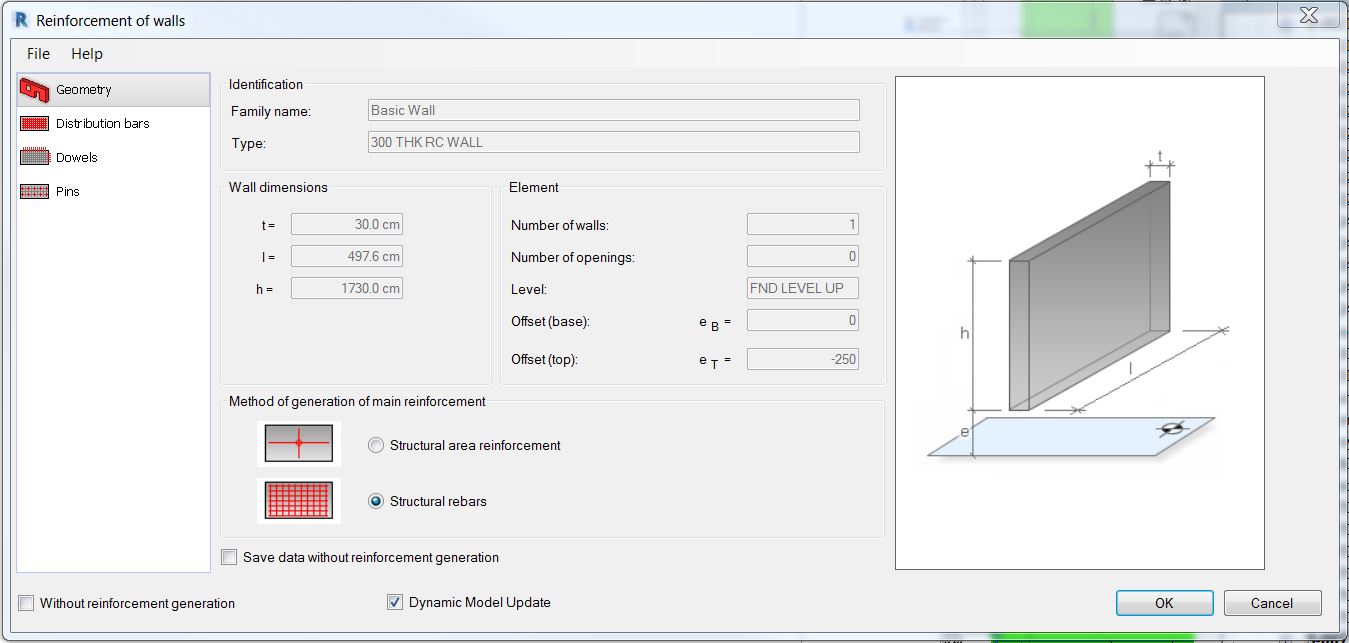
Similar to the column, you don’t have to worry about the geometry; Revit will automatically detect it for you.

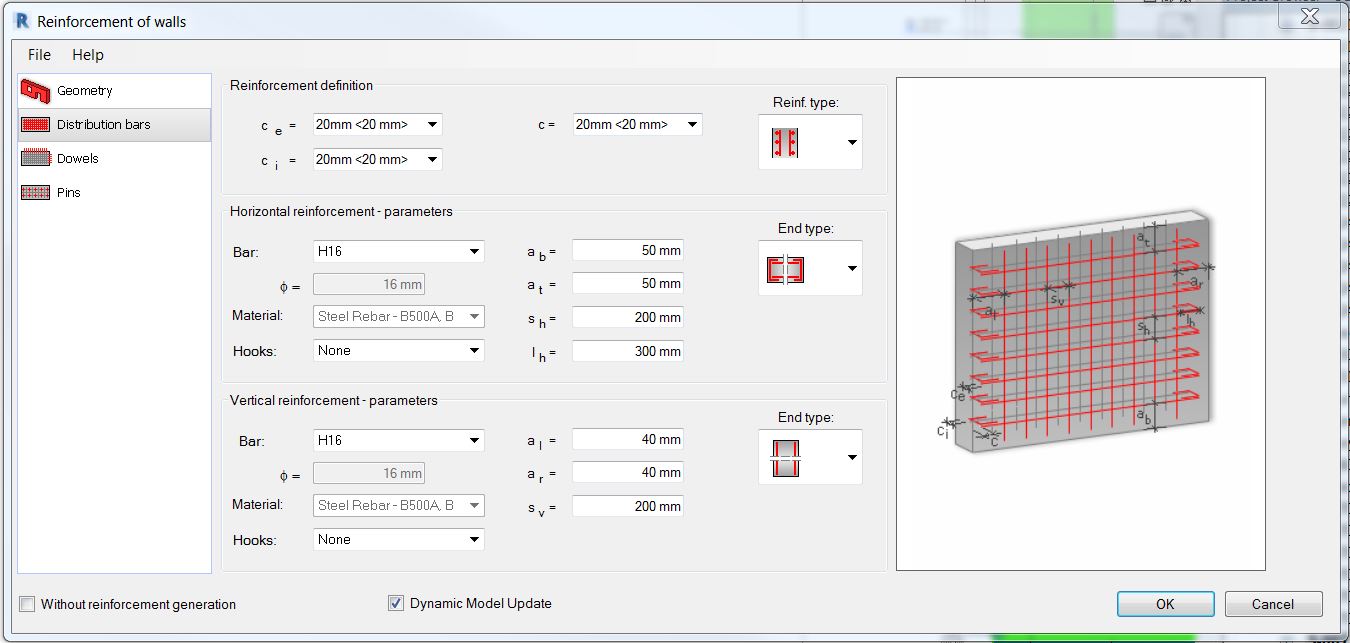
Next is to set up the distribution bars.

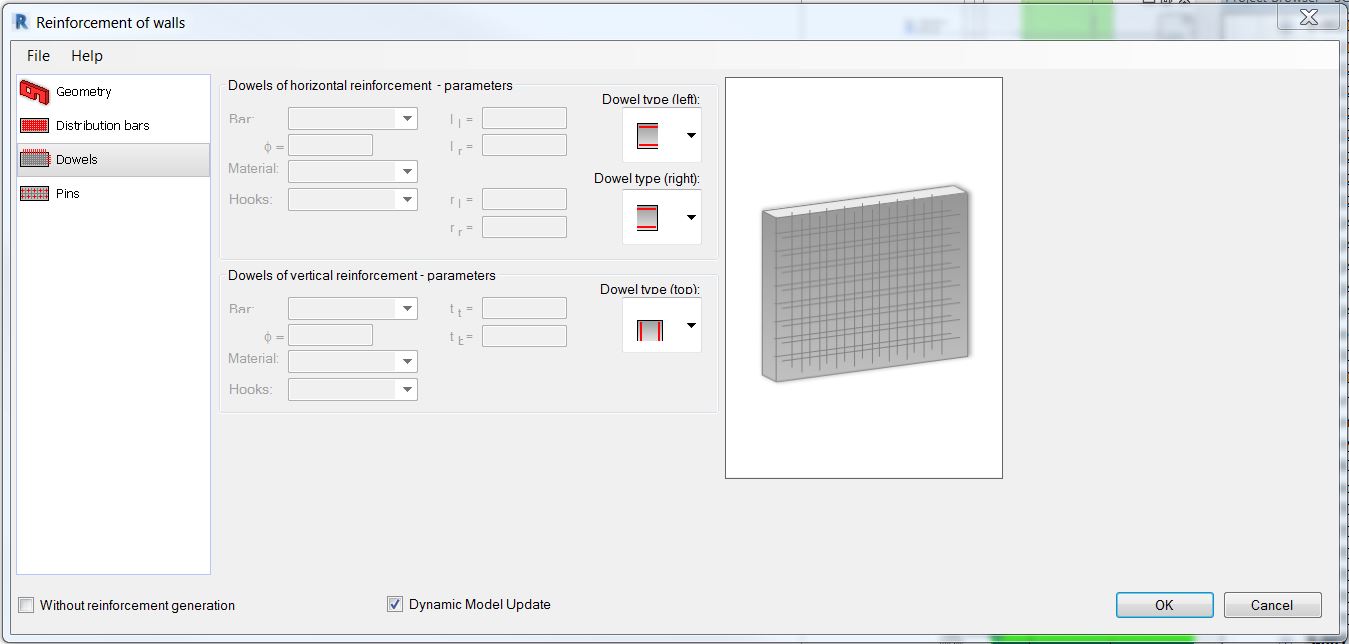
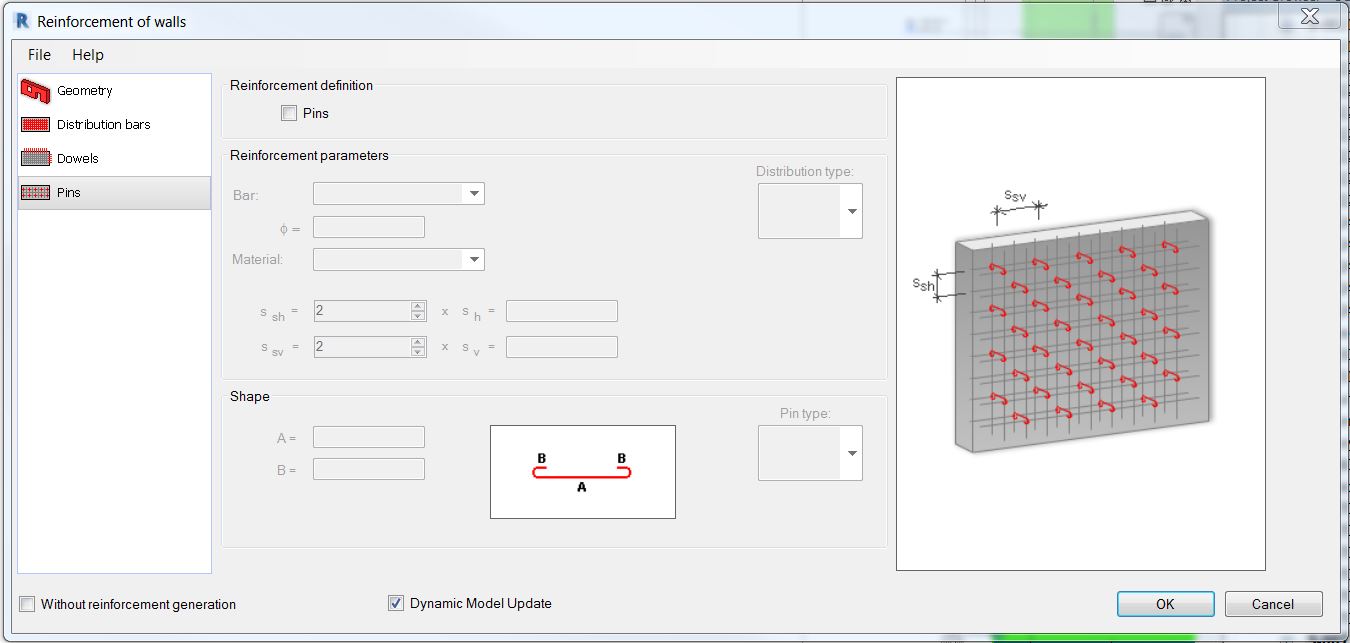
And then I don’t need to worry about setting up the next two option; Dowels and Pins.

Here it is on plan with added annotations.

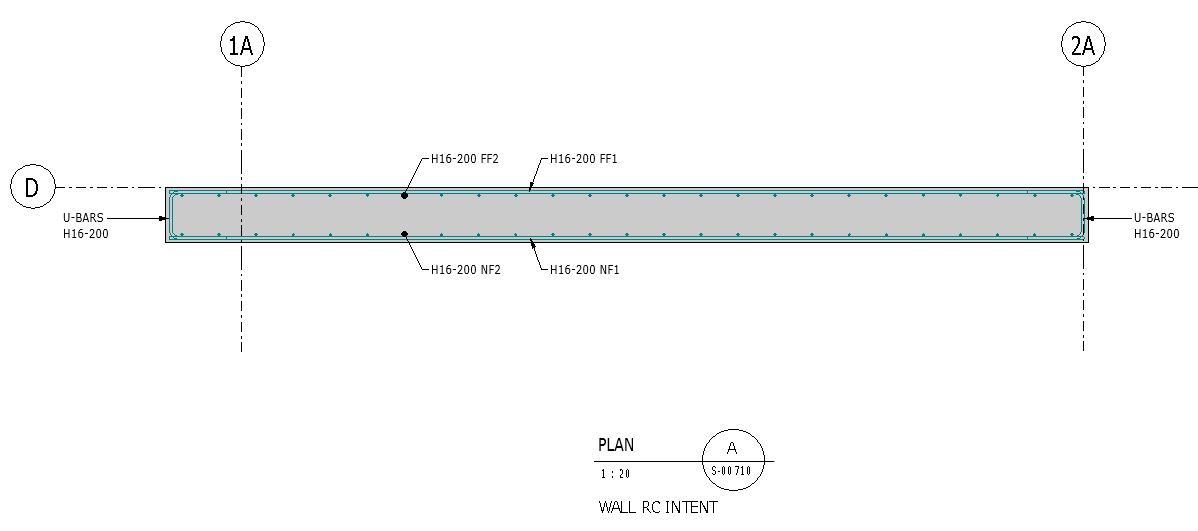
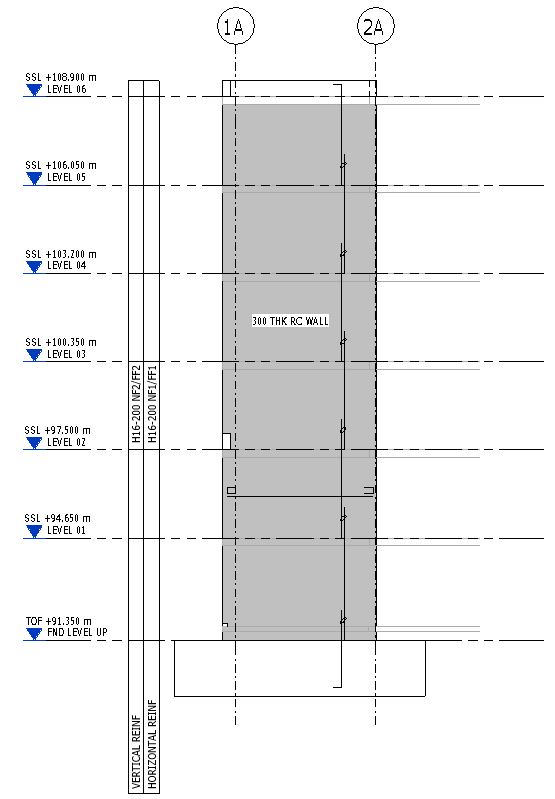
And here is the part where I’ll be needing your another input. Basically, I just drew some detail lines to show my vertical and horizontal reinforcements with additional information at the side showing the reinforcement sizes.

And that should be it. As before if you know of a better way, I am happy to learn from you so please don’t hesitate to share your view. I hope you don’t mind sharing your own workarounds on how to standardize the reinforcement intent presentation on sheets and how do you normally prepare it. I would appreciate it much if you could send me a sample of your work. Thank you in advance.

Until next time!

Best regards,

Allan Cantos

Numbering Piles using Dynamo – Part 2 (No programming knowledge required)

Hi everyone. Today I’ll continue finishing the second part of assigning unique tags to all piles on my Revit structural model and for those of you who missed the first part, here is the link:

https://allscan12.com/index.php/2017/09/29/numbering-piles-using-dynamo-part-1-no-programming-knowledge-required/

We ended up with this node arrangement where I extracted the XYZ coordinates of each pile then filter the X and Y coordinates separately and finally create a sorted list of piles in ascending order with respect to X or Y coordinates.

Next, I set up my spreadsheet listing down in columns what I might need to export using Dynamo from my Revit model.

With that in mind, I started adding those nodes as additional information to be taken out of my sorted pile elements.

Then I’ll list them down in a list.

Convert the columns into rows.

Then time for me to build my export to excel node and connect the transposed list.

Hi “Run” and I will have something like this:

Now I can sort column “Y-COORDINATE” and “X-COORDINATE” in ascending order.

And the result is:

As you can see, I don’t have a problem with arranging the Y-COORDINATE in ascending order but, for whatever reason, Excel did not sort the X-COORDINATE in ascending order. Still looks random to me the highlighted cells and therefore I need to fix the arrangement first before applying “PILE REFERENCE” information.

Here is how it will look like after fixing the sorting arrangement with “PILE REFERENCE”.

And I am done with the first part of exporting the information. Next step is to import back those “PILE REFERENCE” information using read from excel file node in Dynamo.

Before jumping back to Dynamo, I need to do one more step on my excel file by sorting the “PILE ID NUMBER” in ascending order.

Then jump to Dynamo and I’ll start by setting up the nodes to read the excel file then hit “Run”.

Next, I’ll remove the list that contains my column titles.

Convert the columns into rows.

Then I’ll isolate the “PILE REFERENCE” and “PILE ID NUMBER”.

Then add the node to specify the element parameter to use where the “PILE REFERENCE” information will be written.

After that, I need to specify which elements to connect to the “element” input of my “Element.SetParameterByName” node.

Basically, I need to repeat those nodes in isolating the “PILE” from my structural category. Here are the nodes needed.

By examining the list result, the list is now arranged in ascending order which matches with our excel file.

Now I am ready to connect the “in” output of my “List.FilterByBoolMask” node to my “element” input of my “Element.SetParameterByName” node.

My script is now done and I am ready to hit “Run”.

The result:

Now it’s your turn to give it a try and if you have any other information to add to improve the process, please share. I am happy to learn from you. My door is open to find out your Python script or any other processes to remove the process of editing manually, by sorting, the spreadsheet as this will likely cause a human error.

Once again, this process does not include any Python node which requires programming knowledge. Not everyone is knowledgeable in programming language and this is the reason for me to demonstrate that it can be done using the basic Dynamo nodes.

Yesterday I organized a knowledge sharing session where our Revit Leader introduces us to the additional features of Revit Apps called “IdeateApps for Revit” and one of its features is being able to renumber most elements by selection, path, or auto-update method. Once I get the chance to test this for piles, I’ll share to you my experience and how it works.

I hope you like it and until next time.

Have a great weekend!

Cheers!

Allan Cantos

Numbering Piles using Dynamo – Part 1 (No programming knowledge required)

Hi! How are you doing? I trust you are well. It’s been a few weeks since I posted something relevant to Revit. That’s because I have been busy these past weeks.

Now I find some time to document the process of looking at assigning unique tags for all my piles using Dynamo. This is for a new project consists of piled foundations and since I’ll be using Revit 2017, some apps or plugins are no longer available for use for this version. Dynamo help is my only option as eventually, I’ll be numbering my piles anyway. So I’ll make a test first before actually applying this to the project. This is not only for my own reference in the future but to share with you the process as well and hope you’ll find this useful. If you like it, don’t forget to give it a ‘Like’. If you have some knowledge to share, don’t be shy and keep it yourselves, help others learn from your hidden knowledge and experiences. Let’s begin!

First I open my Revit and I started placing piles and pile caps in random and in different pile cap types as shown. They also come in different pile diameters.

Next, I’ll create a Structural Foundation Schedule.

I used Type, Mark and Type Mark

Then we have a built-in text parameter within our company Revit Structural Template called ‘RUKViewFilter’ which I’ll use to specify whether the element is a Pile or Pile Cap. Any text parameter will do actually.

Add a little bit of formatting to schedule Piles only.

Then I rename the schedule to ‘PILE SCHEDULE’ and add the other necessary parameters I normally use to create Pile Schedule. Mine looks like the one below without the columns for the loadings.

While the ‘PILE SCHEDULE’ is still open, I highlight all the piles then I go to my view where I can only see my piles (in my case ‘PILE LEVEL’), select all the piles and assign a tag by ‘Mark’.

And I should have something like this:

The goal of this demonstration is to provide a unique ‘PILE REFERENCE’ for each pile and to complicate things, I want the Pile Reference to be added in ascending order which starts from the one nearest to (0,0) coordinates. The naming should start by looking at the Y-coordinates first that is nearest to origin then followed by X-coordinates. I manually assigned the tags for each pile (see below) and I’ll see if I’ll be able to get the same tagging arrangement using Dynamo.

Let me hit ‘Undo’ button to remove all the tags because I want Dynamo to do it for me.

After that, let me jump to Dynamo and begin the exciting part: building the graph or script.

Now open Dynamo.

If you have two or more versions of Dynamo installed on your machine, use the latest one.

Create ‘New’ file

Don’t forget to save the file first.

Next, I begin with pulling out all the structural foundation categories.

As you can see, I have piles and pile caps. I am after only with piles and therefore I need a way to separate them. If you remember I have a filter called ‘RUKViewFilter’ which allows me to specify whether the element is a pile or a pile cap.

Next node I need is called ‘Element.GetParameterValueByName’ and under the ‘parameterName’ I’ll connect the string called ‘RUKViewFilter’.

Next is to split PILE to PILE CAP. I need a node called ‘==’. What is this node does is to compare x input to y input and gives you a true or false result.

Then I need a node called ‘List.FilterByBooMask’ which separate true and false results based on the input list.

Now I need the location in XYZ coordinates of all my RC piles. To do that I need a node called ‘FamilyInstance.Location’.

Then I’ll isolate the Y-coordinates.

And next is to use ‘List.SortByKey’ node to sort the Y-coordinates in ascending order.

However, I need a list to connect to the ‘list’ input of my ‘List.SortByKey’ node. Therefore I need to create a list using ‘List.Create’ node and I want to list down the pile type and the coordinates.

Transpose the list using ‘List.Transpose’ node so I’ll have the pile type and it’s corresponding coordinate location.

Then connect the transposed list to the ‘List.SortByKey’ node as shown.

Now I have a list of piles in ascending order with respect to the Y-coordinates.

Let me do sort my piles in ascending order with respect to the X-coordinates and I should have something like the one below.

Now here is where the part-1 will stop. Next step is to figure out how to sort my list of piles in Y-direction first and followed by X-direction simultaneously instead of having two separate lists in ascending order with respect to Y-coordinate and X-coordinate respectively.

I came across in one of the posts on LinkedIn from Mr.Alexander Tohidi about the use of an algorithm called ‘Bubble Sort’. Here is the link to his interesting post on LinkedIn: https://www.linkedin.com/feed/update/urn:li:activity:6317768340404342785

Just to give you a bit of idea, ‘Bubble sort’ is a simple sorting algorithm. This sorting algorithm is a comparison-based algorithm in which each pair of adjacent elements is compared and the elements are swapped if they are not in order.

Another way to do this is to export my list to the spreadsheet and sort it there then assign my instance pile reference parameter and push it back to Revit using ‘Excel.ReadFromPile’ node in Dynamo (this requires another Dynamo file).

I’ll post the part-2 as soon as I have completed the test.

If you know a better way or if you have any questions just let me know and I’ll do my best to answer!

Positive SSL