Numbering Piles using Dynamo – Part 2 (No programming knowledge required)

Hi everyone. Today I’ll continue finishing the second part of assigning unique tags to all piles on my Revit structural model and for those of you who missed the first part, here is the link:

https://allscan12.com/index.php/2017/09/29/numbering-piles-using-dynamo-part-1-no-programming-knowledge-required/

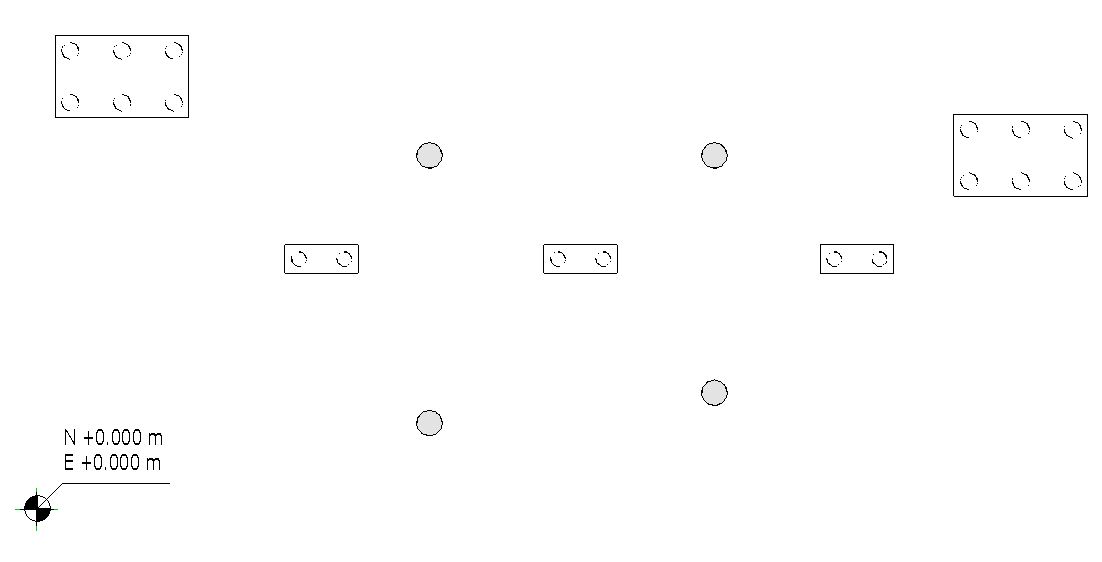
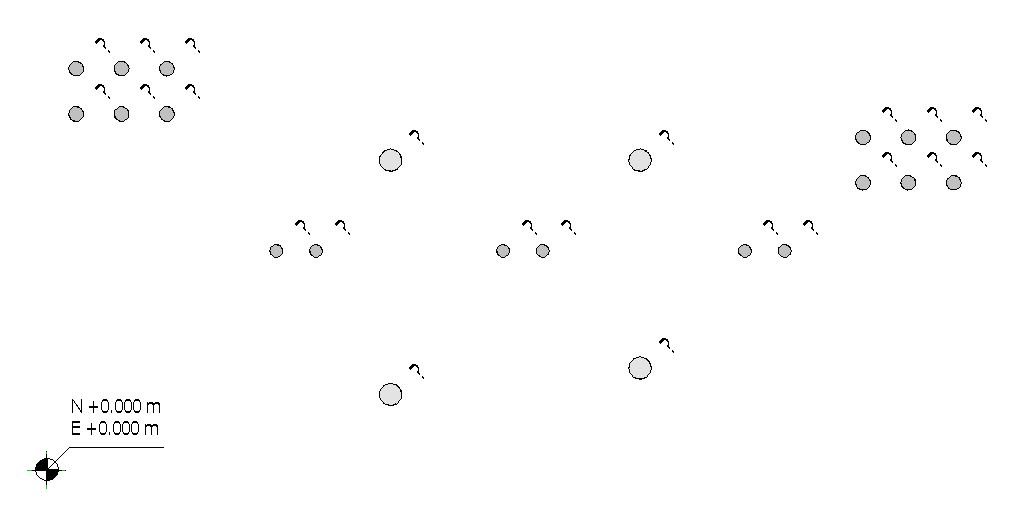
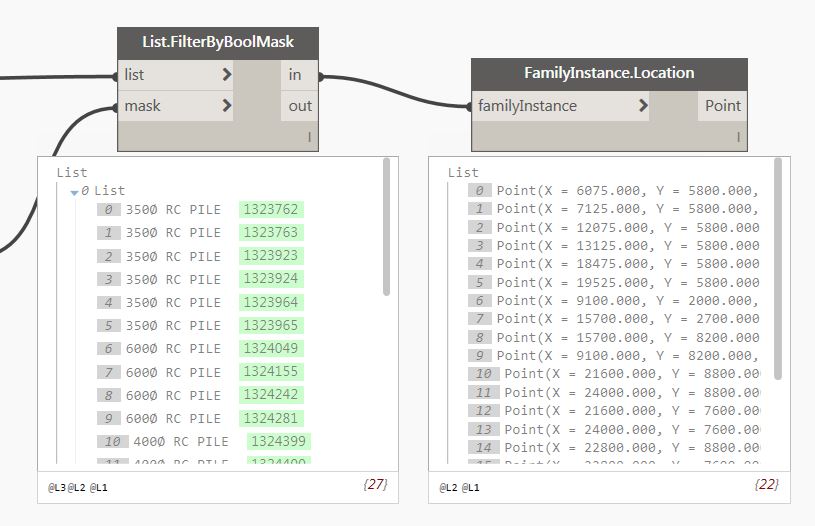
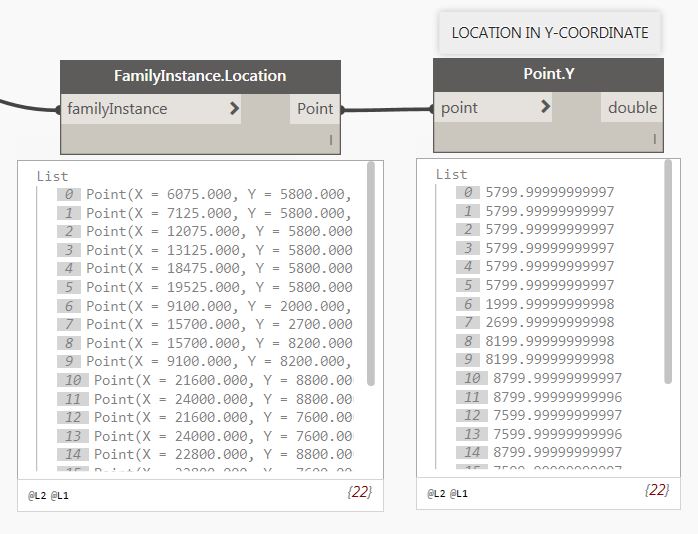
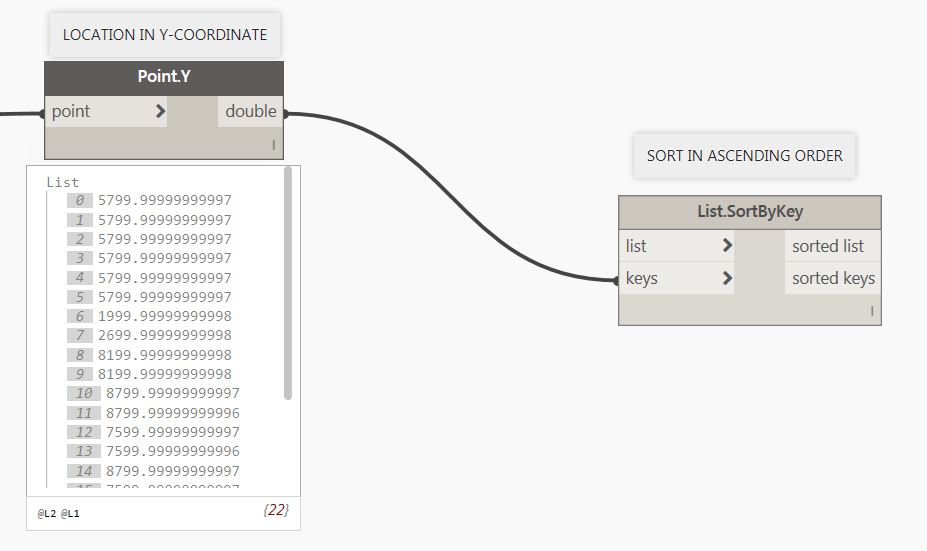
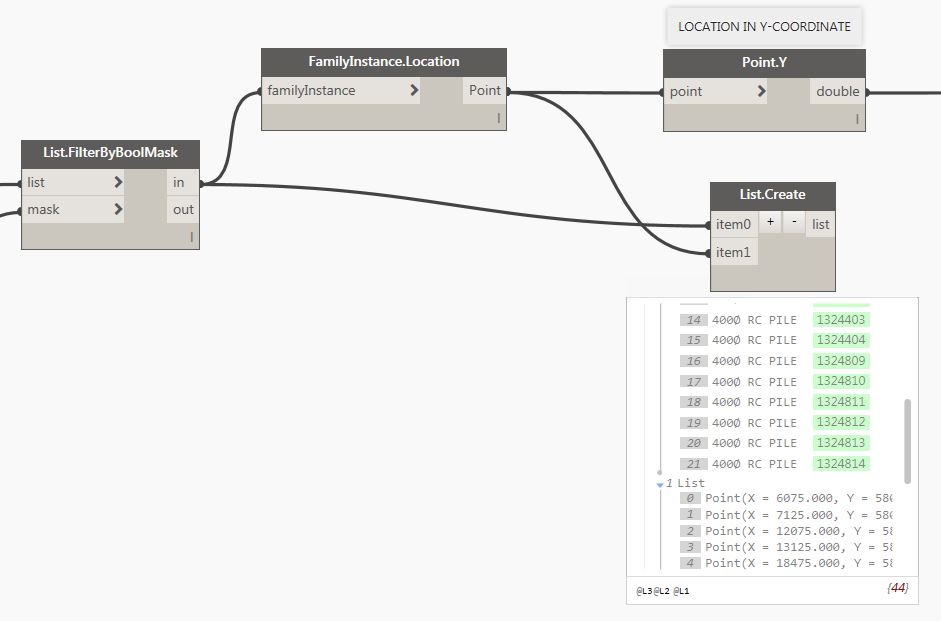
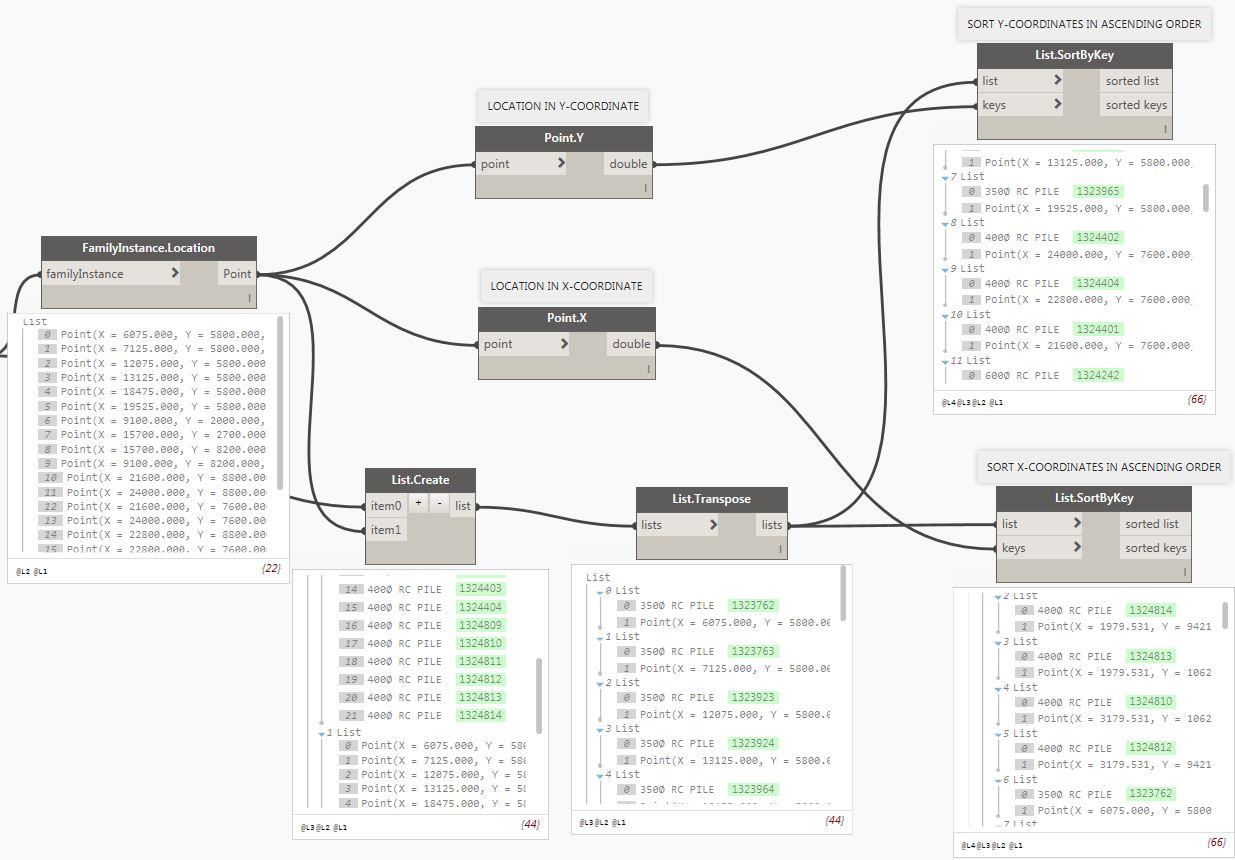
We ended up with this node arrangement where I extracted the XYZ coordinates of each pile then filter the X and Y coordinates separately and finally create a sorted list of piles in ascending order with respect to X or Y coordinates.

Next, I set up my spreadsheet listing down in columns what I might need to export using Dynamo from my Revit model.

With that in mind, I started adding those nodes as additional information to be taken out of my sorted pile elements.

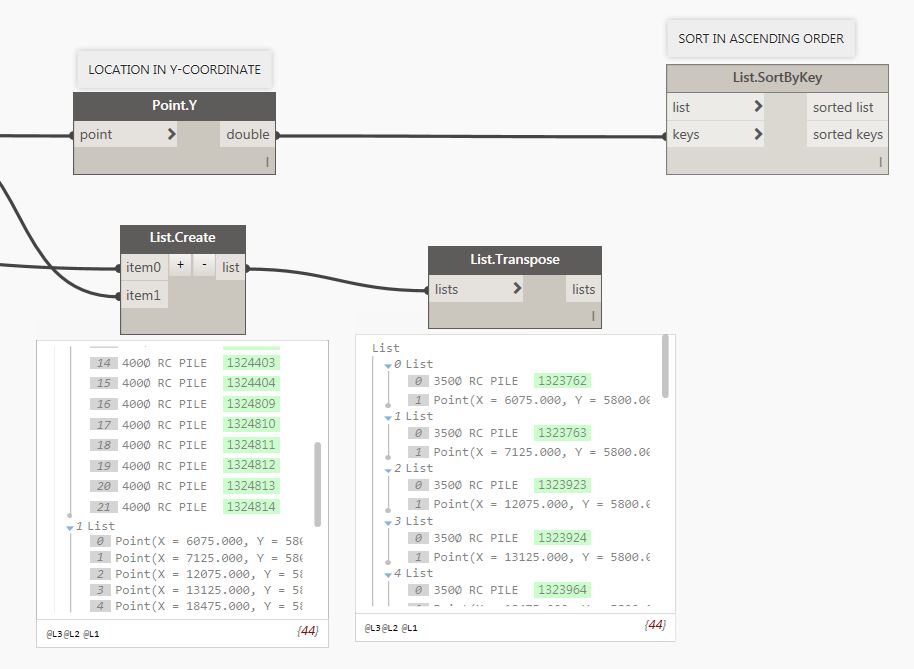
Then I’ll list them down in a list.

Convert the columns into rows.

Then time for me to build my export to excel node and connect the transposed list.

Hi “Run” and I will have something like this:

Now I can sort column “Y-COORDINATE” and “X-COORDINATE” in ascending order.

And the result is:

As you can see, I don’t have a problem with arranging the Y-COORDINATE in ascending order but, for whatever reason, Excel did not sort the X-COORDINATE in ascending order. Still looks random to me the highlighted cells and therefore I need to fix the arrangement first before applying “PILE REFERENCE” information.

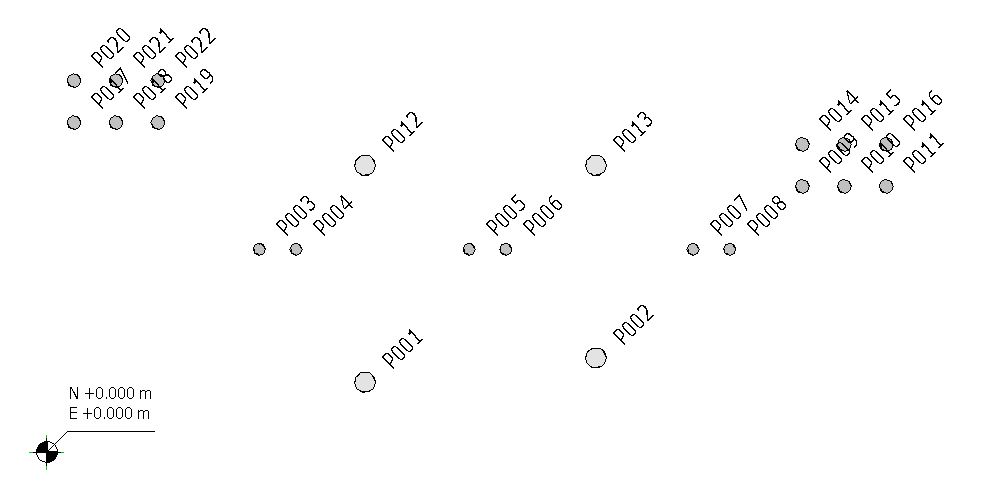
Here is how it will look like after fixing the sorting arrangement with “PILE REFERENCE”.

And I am done with the first part of exporting the information. Next step is to import back those “PILE REFERENCE” information using read from excel file node in Dynamo.

Before jumping back to Dynamo, I need to do one more step on my excel file by sorting the “PILE ID NUMBER” in ascending order.

Then jump to Dynamo and I’ll start by setting up the nodes to read the excel file then hit “Run”.

Next, I’ll remove the list that contains my column titles.

Convert the columns into rows.

Then I’ll isolate the “PILE REFERENCE” and “PILE ID NUMBER”.

Then add the node to specify the element parameter to use where the “PILE REFERENCE” information will be written.

After that, I need to specify which elements to connect to the “element” input of my “Element.SetParameterByName” node.

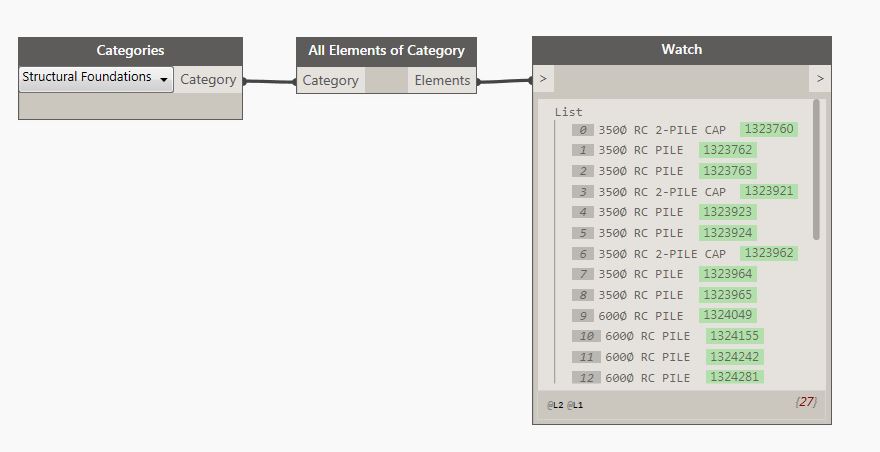
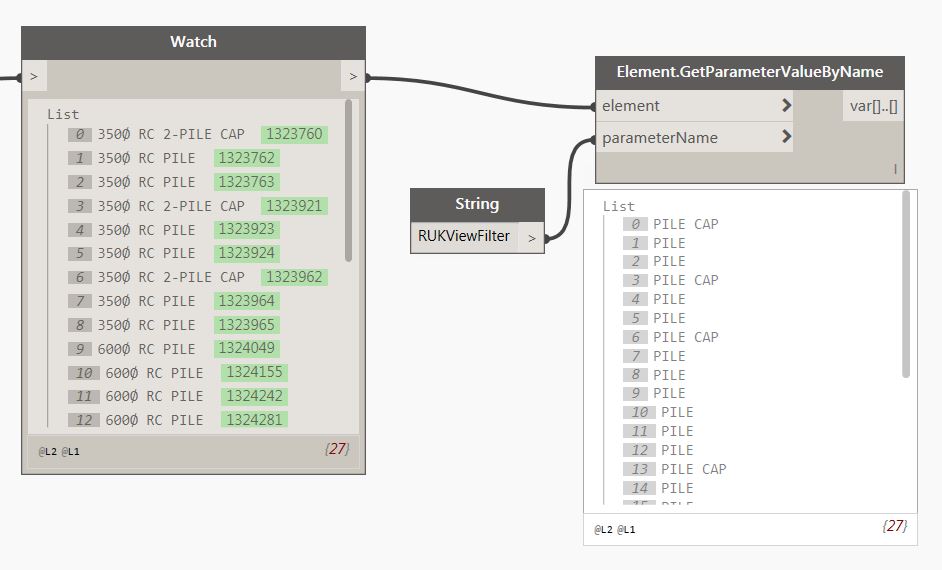
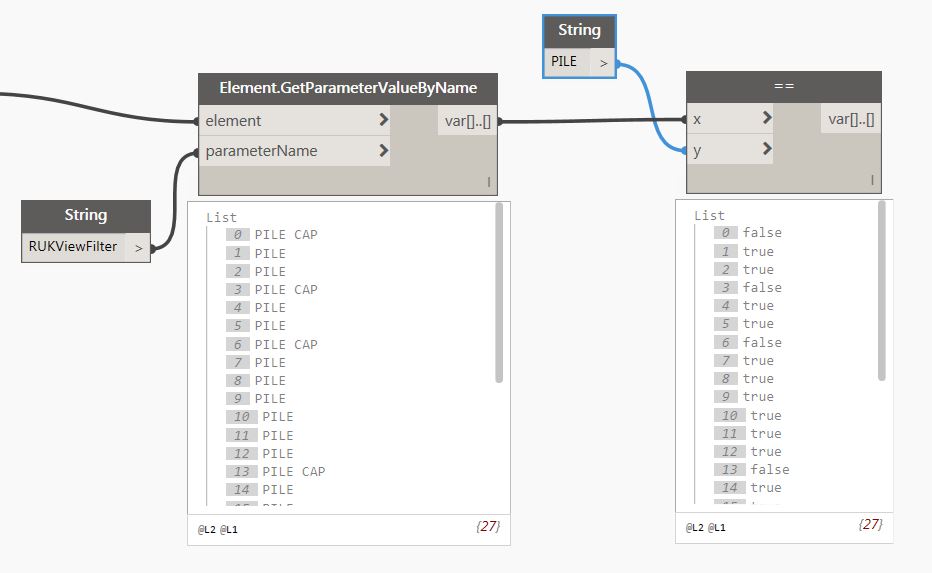
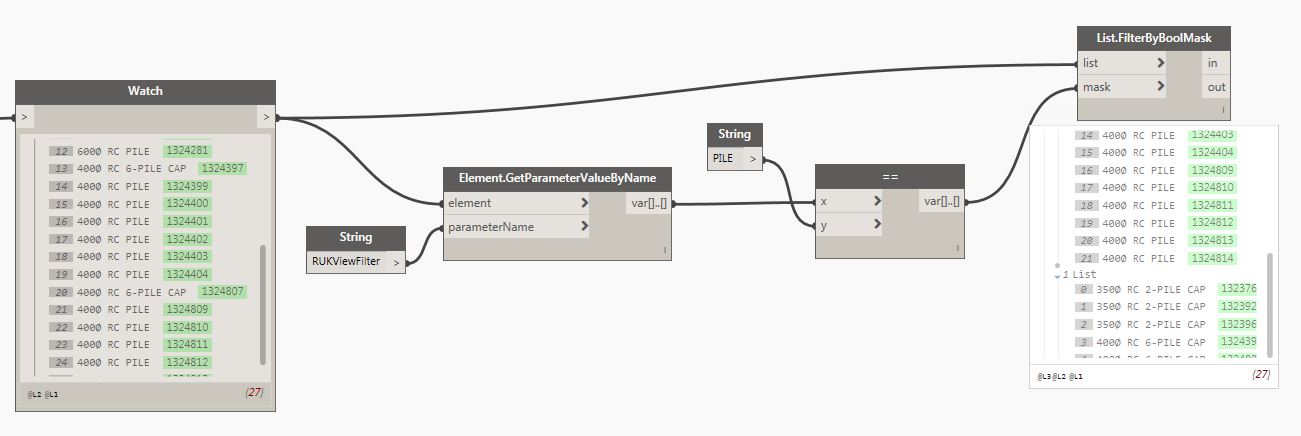
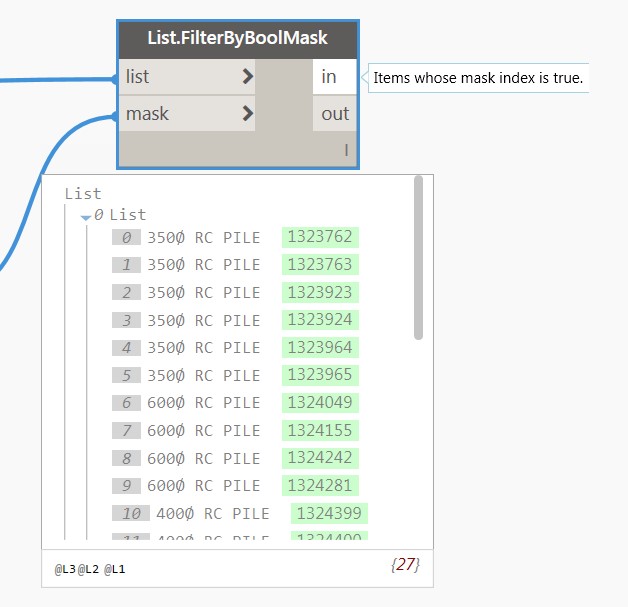
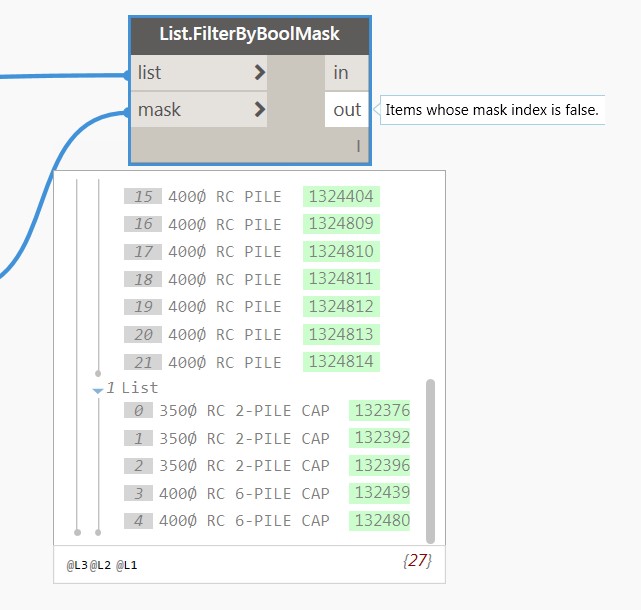
Basically, I need to repeat those nodes in isolating the “PILE” from my structural category. Here are the nodes needed.

By examining the list result, the list is now arranged in ascending order which matches with our excel file.

Now I am ready to connect the “in” output of my “List.FilterByBoolMask” node to my “element” input of my “Element.SetParameterByName” node.

My script is now done and I am ready to hit “Run”.

The result:

Now it’s your turn to give it a try and if you have any other information to add to improve the process, please share. I am happy to learn from you. My door is open to find out your Python script or any other processes to remove the process of editing manually, by sorting, the spreadsheet as this will likely cause a human error.

Once again, this process does not include any Python node which requires programming knowledge. Not everyone is knowledgeable in programming language and this is the reason for me to demonstrate that it can be done using the basic Dynamo nodes.

Yesterday I organized a knowledge sharing session where our Revit Leader introduces us to the additional features of Revit Apps called “IdeateApps for Revit” and one of its features is being able to renumber most elements by selection, path, or auto-update method. Once I get the chance to test this for piles, I’ll share to you my experience and how it works.

I hope you like it and until next time.

Have a great weekend!

Cheers!

Allan Cantos

Numbering Piles using Dynamo – Part 1 (No programming knowledge required)

Hi! How are you doing? I trust you are well. It’s been a few weeks since I posted something relevant to Revit. That’s because I have been busy these past weeks.

Now I find some time to document the process of looking at assigning unique tags for all my piles using Dynamo. This is for a new project consists of piled foundations and since I’ll be using Revit 2017, some apps or plugins are no longer available for use for this version. Dynamo help is my only option as eventually, I’ll be numbering my piles anyway. So I’ll make a test first before actually applying this to the project. This is not only for my own reference in the future but to share with you the process as well and hope you’ll find this useful. If you like it, don’t forget to give it a ‘Like’. If you have some knowledge to share, don’t be shy and keep it yourselves, help others learn from your hidden knowledge and experiences. Let’s begin!

First I open my Revit and I started placing piles and pile caps in random and in different pile cap types as shown. They also come in different pile diameters.

Next, I’ll create a Structural Foundation Schedule.

I used Type, Mark and Type Mark

Then we have a built-in text parameter within our company Revit Structural Template called ‘RUKViewFilter’ which I’ll use to specify whether the element is a Pile or Pile Cap. Any text parameter will do actually.

Add a little bit of formatting to schedule Piles only.

Then I rename the schedule to ‘PILE SCHEDULE’ and add the other necessary parameters I normally use to create Pile Schedule. Mine looks like the one below without the columns for the loadings.

While the ‘PILE SCHEDULE’ is still open, I highlight all the piles then I go to my view where I can only see my piles (in my case ‘PILE LEVEL’), select all the piles and assign a tag by ‘Mark’.

And I should have something like this:

The goal of this demonstration is to provide a unique ‘PILE REFERENCE’ for each pile and to complicate things, I want the Pile Reference to be added in ascending order which starts from the one nearest to (0,0) coordinates. The naming should start by looking at the Y-coordinates first that is nearest to origin then followed by X-coordinates. I manually assigned the tags for each pile (see below) and I’ll see if I’ll be able to get the same tagging arrangement using Dynamo.

Let me hit ‘Undo’ button to remove all the tags because I want Dynamo to do it for me.

After that, let me jump to Dynamo and begin the exciting part: building the graph or script.

Now open Dynamo.

If you have two or more versions of Dynamo installed on your machine, use the latest one.

Create ‘New’ file

Don’t forget to save the file first.

Next, I begin with pulling out all the structural foundation categories.

As you can see, I have piles and pile caps. I am after only with piles and therefore I need a way to separate them. If you remember I have a filter called ‘RUKViewFilter’ which allows me to specify whether the element is a pile or a pile cap.

Next node I need is called ‘Element.GetParameterValueByName’ and under the ‘parameterName’ I’ll connect the string called ‘RUKViewFilter’.

Next is to split PILE to PILE CAP. I need a node called ‘==’. What is this node does is to compare x input to y input and gives you a true or false result.

Then I need a node called ‘List.FilterByBooMask’ which separate true and false results based on the input list.

Now I need the location in XYZ coordinates of all my RC piles. To do that I need a node called ‘FamilyInstance.Location’.

Then I’ll isolate the Y-coordinates.

And next is to use ‘List.SortByKey’ node to sort the Y-coordinates in ascending order.

However, I need a list to connect to the ‘list’ input of my ‘List.SortByKey’ node. Therefore I need to create a list using ‘List.Create’ node and I want to list down the pile type and the coordinates.

Transpose the list using ‘List.Transpose’ node so I’ll have the pile type and it’s corresponding coordinate location.

Then connect the transposed list to the ‘List.SortByKey’ node as shown.

Now I have a list of piles in ascending order with respect to the Y-coordinates.

Let me do sort my piles in ascending order with respect to the X-coordinates and I should have something like the one below.

Now here is where the part-1 will stop. Next step is to figure out how to sort my list of piles in Y-direction first and followed by X-direction simultaneously instead of having two separate lists in ascending order with respect to Y-coordinate and X-coordinate respectively.

I came across in one of the posts on LinkedIn from Mr.Alexander Tohidi about the use of an algorithm called ‘Bubble Sort’. Here is the link to his interesting post on LinkedIn: https://www.linkedin.com/feed/update/urn:li:activity:6317768340404342785

Just to give you a bit of idea, ‘Bubble sort’ is a simple sorting algorithm. This sorting algorithm is a comparison-based algorithm in which each pair of adjacent elements is compared and the elements are swapped if they are not in order.

Another way to do this is to export my list to the spreadsheet and sort it there then assign my instance pile reference parameter and push it back to Revit using ‘Excel.ReadFromPile’ node in Dynamo (this requires another Dynamo file).

I’ll post the part-2 as soon as I have completed the test.

If you know a better way or if you have any questions just let me know and I’ll do my best to answer!

Comparing information take-off using Solibri with Revit-Dynamo workflow

What’s up, guys? How are you all doing? I trust you’re all doing well. Today I am looking at comparing information take-off using Solibri with Revit-Dynamo workflow. I am curious about what information Solibri provides in terms of Information take-off and whether the value I’ll get will be the same if I do the exercise using Revit-Dynamo workflow.

Here is my video recording while doing the exercise:

Here is the link for the previous post to find out how I set up my schedules:

Revit-Dynamo-Power BI Workflow

And here is the part 2 on how I set up my Dynamo graph:

Revit-Dynamo-Power BI – Part 2

I hope you find it interesting and apologies for some sound effects while doing the recording (“,).

Here is the result.

As you can see, there are slight differences between slabs, beams and foundation volume calculation between two packages.

Now let me try another model. I’ll call it Building B01. Here is the model in Revit.

And here it is in Solibri.

And the results:

As you can see, there is a discrepancy in the “Foundation” volume calculation.

Once you have the report exported from Solibri, you can add the additional column to calculate the total tonnage but before actually exporting it, you may need to find a way to separate concrete to steel as both elements have different unit weight.

I hope you learn something from this demonstration.

Have a great day.

Cheers,

Allan Cantos

Positive SSL